
1050 Data visualizations Categorized "my city in data" (page 9 of 53)
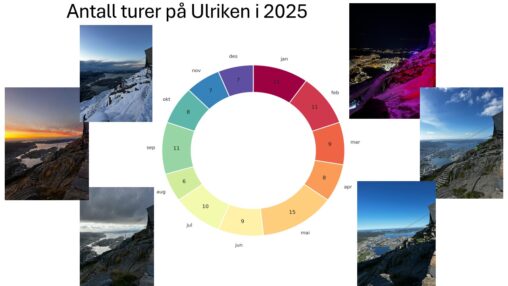
Jeg har visulisert mine turer opp Ulriken (643 moh.) månedlig i 2025. Jeg gikk totalt 104 turer og tok bilde fra samme sted på hver tur.
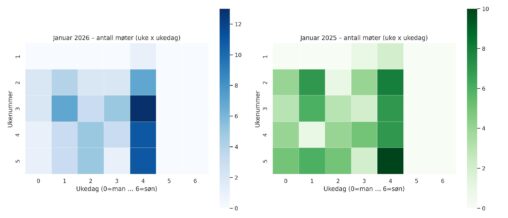
Antall møter per ukedag per uke i januar for både 2025 og 2026, basert på data fra business kalenderen. To varmekart side‑om‑side, der hver rad er ukenummer og…
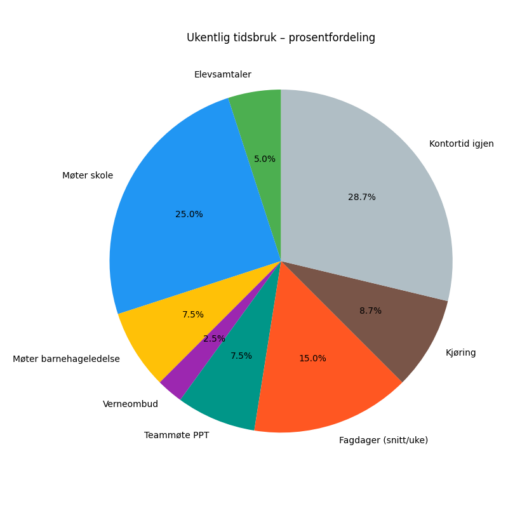
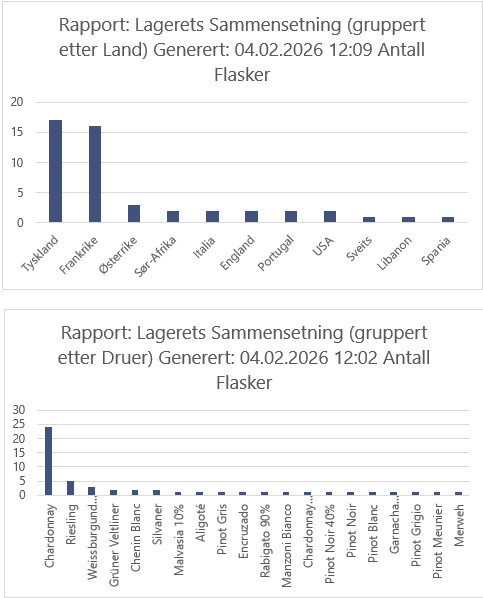
data er hentet ut fra min jobb kalender med avtaler og min kjøredagbok. Jeg har lagt dette inn i ki og “jobbet fram” et kakediagram som skal vise…
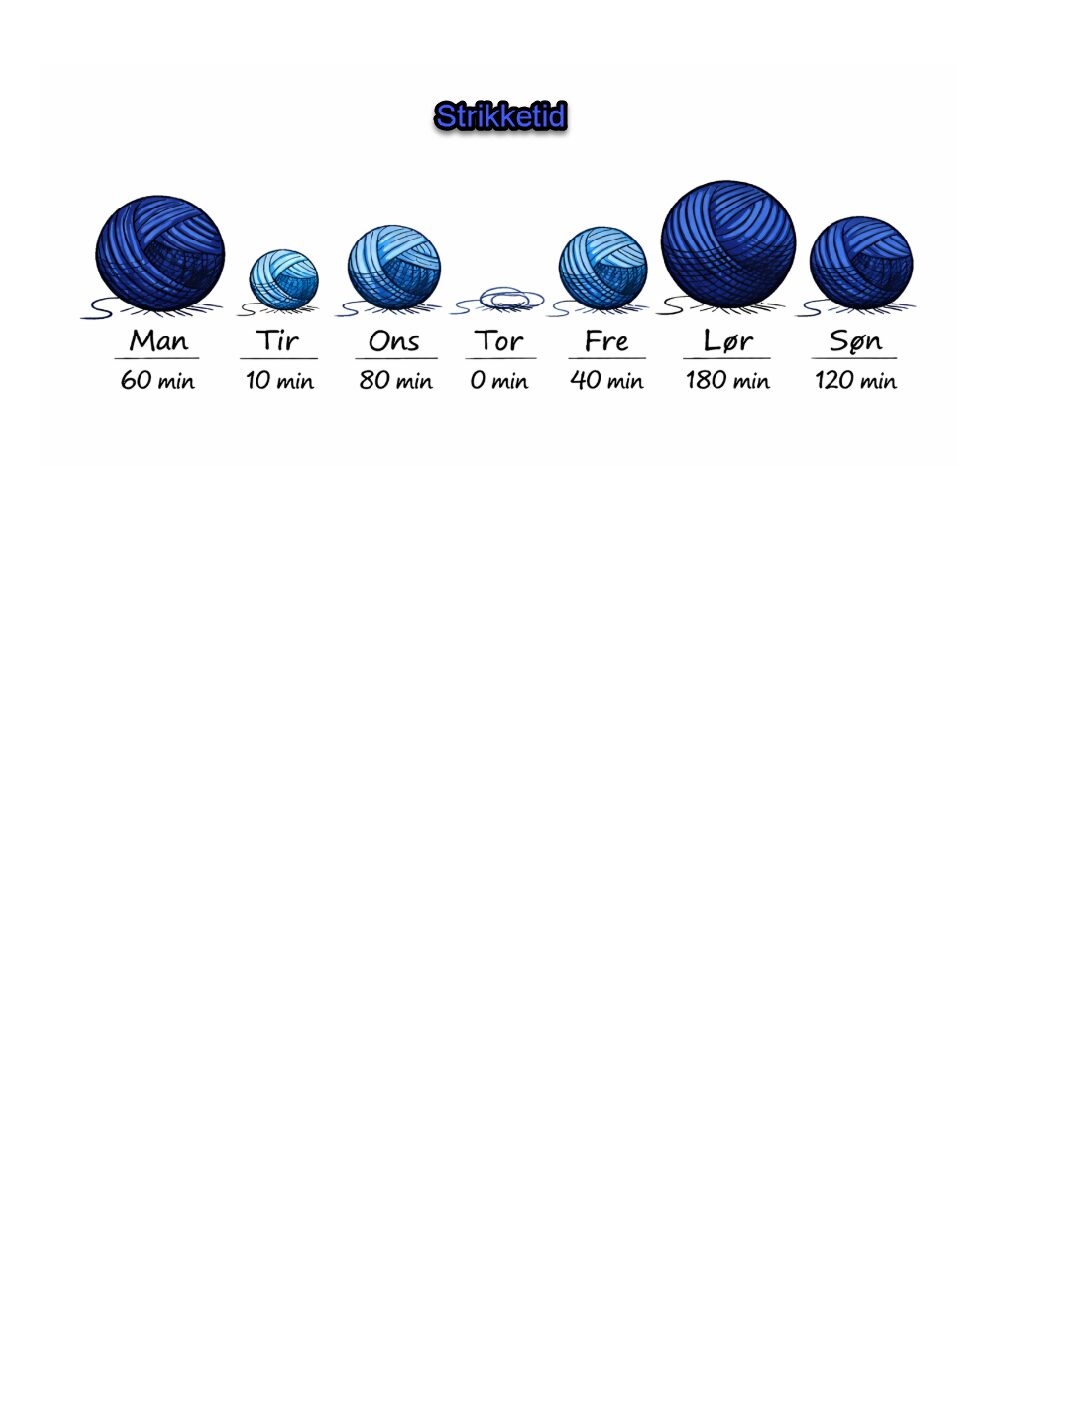
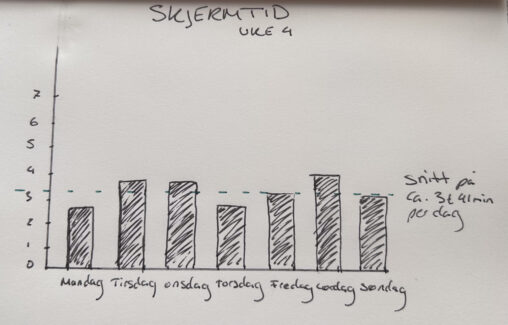
Som en ihuga strikker har jeg oversikt over antall strikkeminutter per dag. Her har jeg fått hjelp av KI til å visualisere forrige ukes strikkeinnsats.
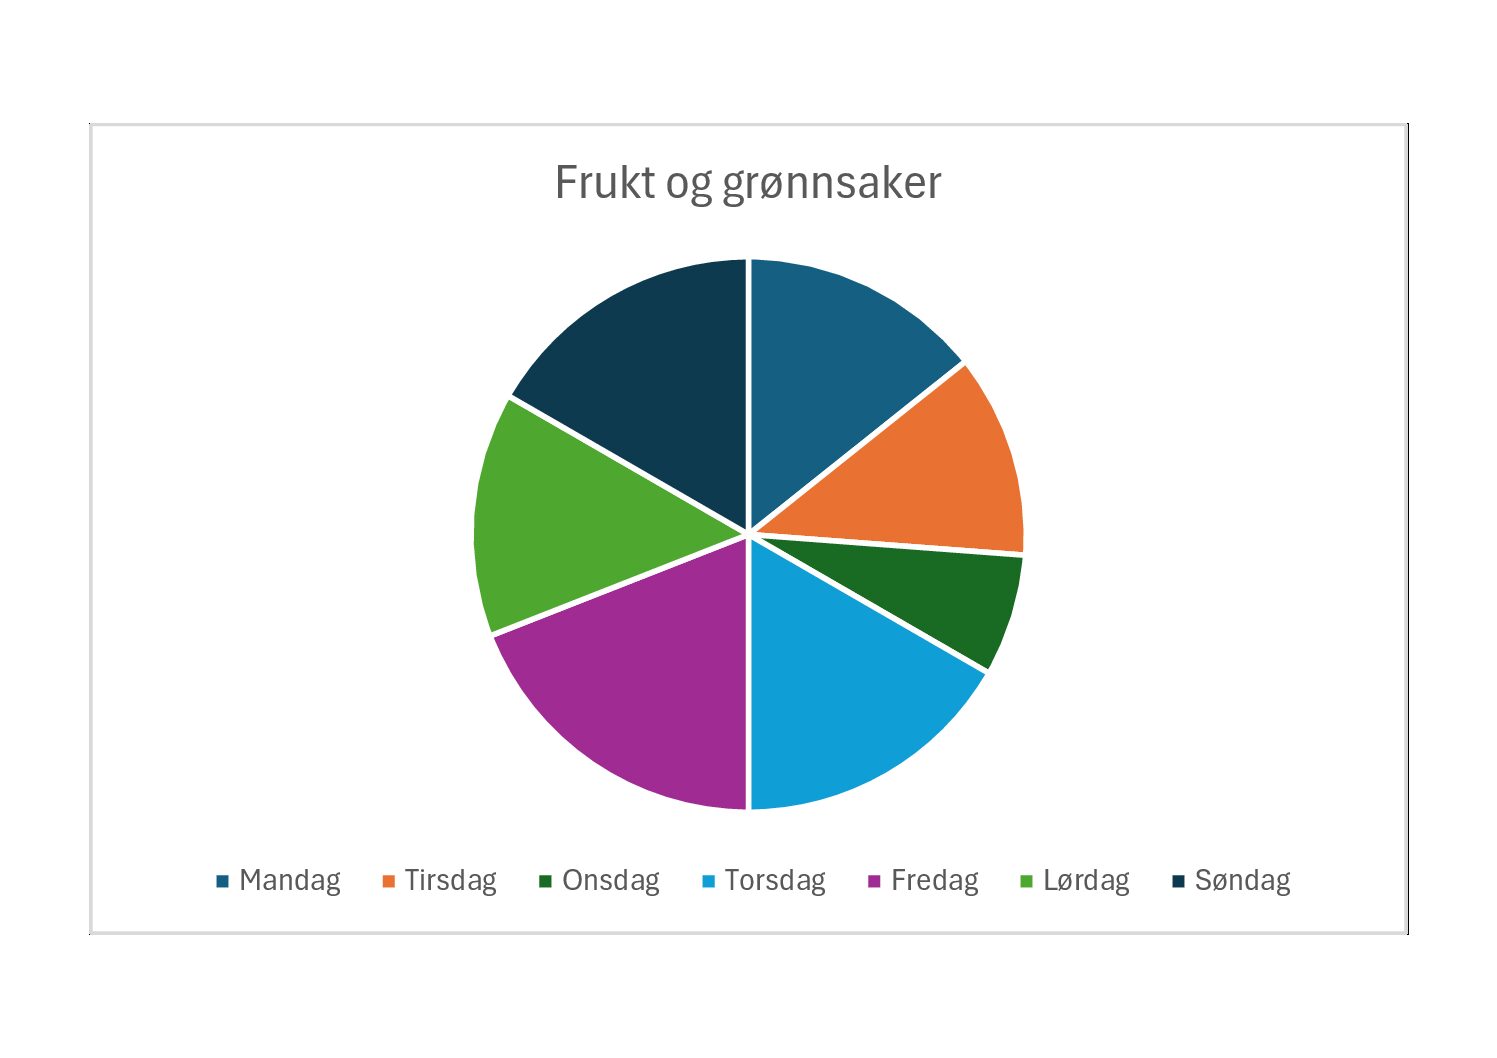
Data viser hvor mange frukt and grønnsaker en person spiser hver dag i løpet av en uke.
Data viser hvor mange frukt og grønnsaker spiser en person hver dag i løpet av en uke.
Data viser hvor mange frukt og grønnsaker en person spiser hver dag i løpet av en uke.
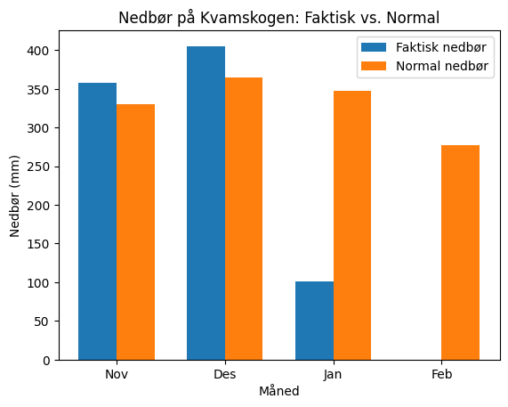
Visualiseringen viser at nedbøren på Kvamskogen var høyere enn normalen i november og desember 2025, mens januar og februar 2026 hadde betydelig lavere nedbør enn normalen.
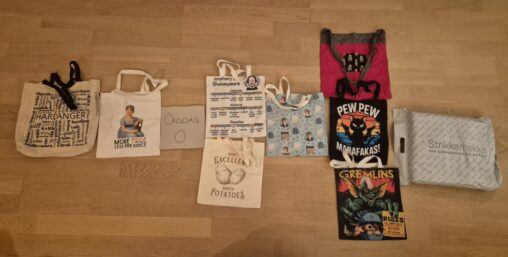
Illustrasjon av mine handleturer forrige uke, både i butikk og på Internett, illustrert med mine handlenett.
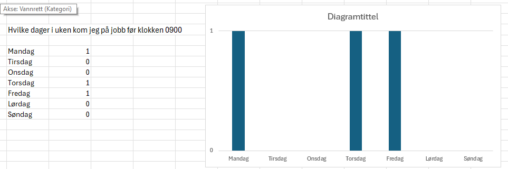
Hvilke dager jeg kom på jobb før klokken 0900 i uke 6. 1 betyr før 0900 0 betyr etter 0900
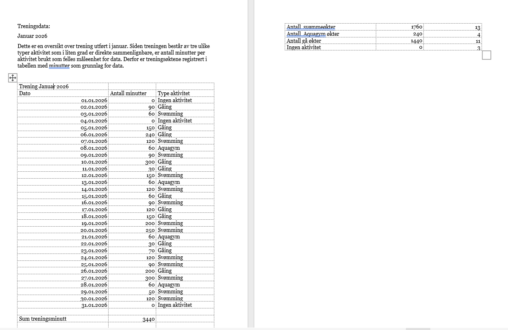
Dette er en oversikt over trening utført i januar. Siden treningen består av tre ulike typer aktivitet som i liten grad er direkte sammenlignbare, er antall minutter per…
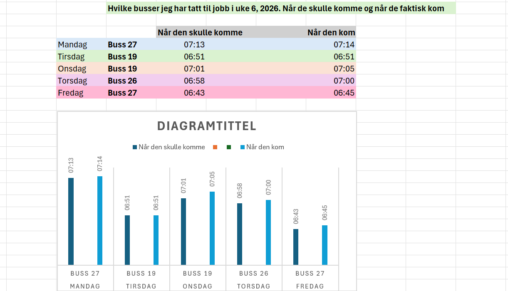
Busser jeg har tatt til jobb siste uke. Når de faktisk skulle komme basert på data fra skyss.no og når de faktisk kom basert på egen klokke, både…

Dette er en oversikt over trening utført i januar. Siden treningen består av tre ulike typer aktivitet som i liten grad er direkte sammenlignbare, er antall minutter per…
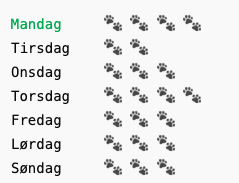
Denne visualiseringen viser hvor mange turer jeg går med hunden hver dag i løpet av én uke. Dataen er samlet manuelt og representerer en viktig del av hverdagen…
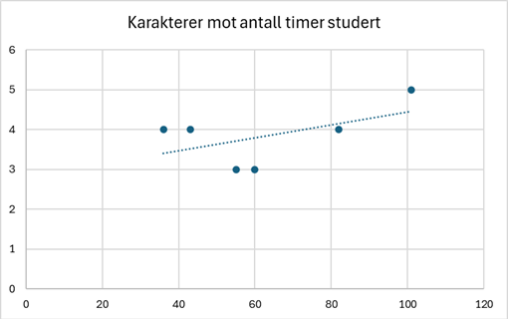
The visualization shows a scatter plot that plots the hours spent studying for six separate 10 ECTS university level courses of varying difficulty and the grade of the…