
1051 Data visualizations Categorized "my city in data" (page 7 of 53)
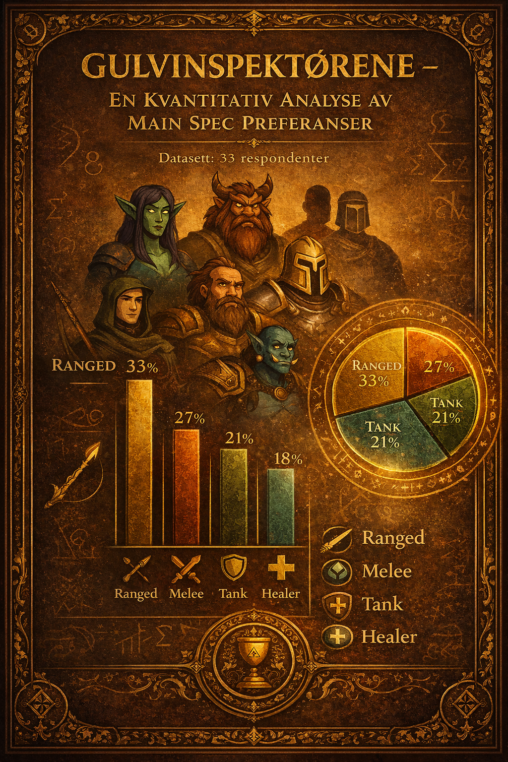
Som raidleder i Gulvinspektørene har jeg ansvar for å holde oversikt over hvilke roller spillerne tar i Midnight. Før vi går løs på kveldens utfordringer, sjekker jeg at…
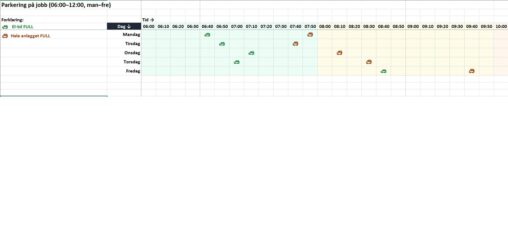
Siden sentraliseringen av kontorbyggene i 2015 har parkeringsutfordringene vært økende. Overgangen fra cellekontorer til kontorlandskap gjør at flere ansatte nå jobber på samme areal enn tidligere. Erfaringstall samlet…
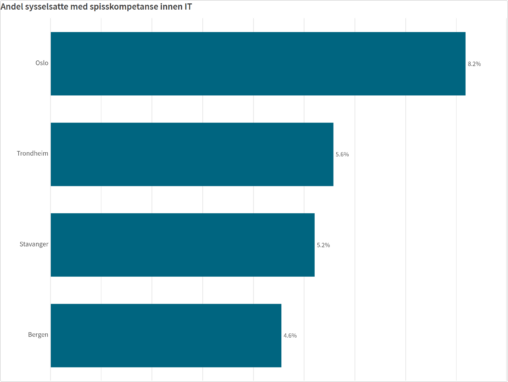
Spisskompetanse innen IT er viktig for at vi på vestlandet skal lykkes med å finne nye bein å stå på, i en region som i dag er avhengig…
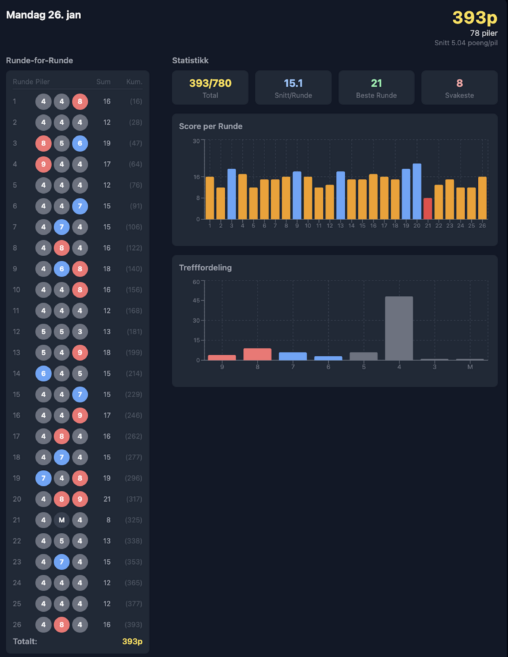
Jeg registrerte resultatet under en bueskyting-trening. Vi skyter 3 og 3 piler under hele treningen. Denne kvelden rakk jeg 26 runder a 3 skudd. Maks poeng per pil…
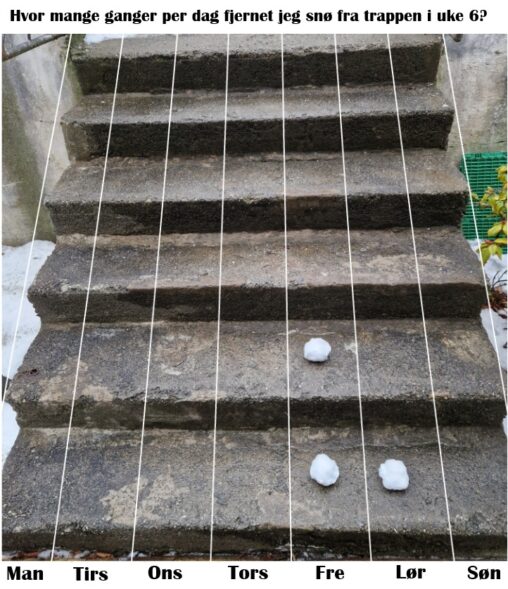
Hvor mange ganger fjernet jeg snø fra trappen i uke 6? Owner of the data is myself 🙂
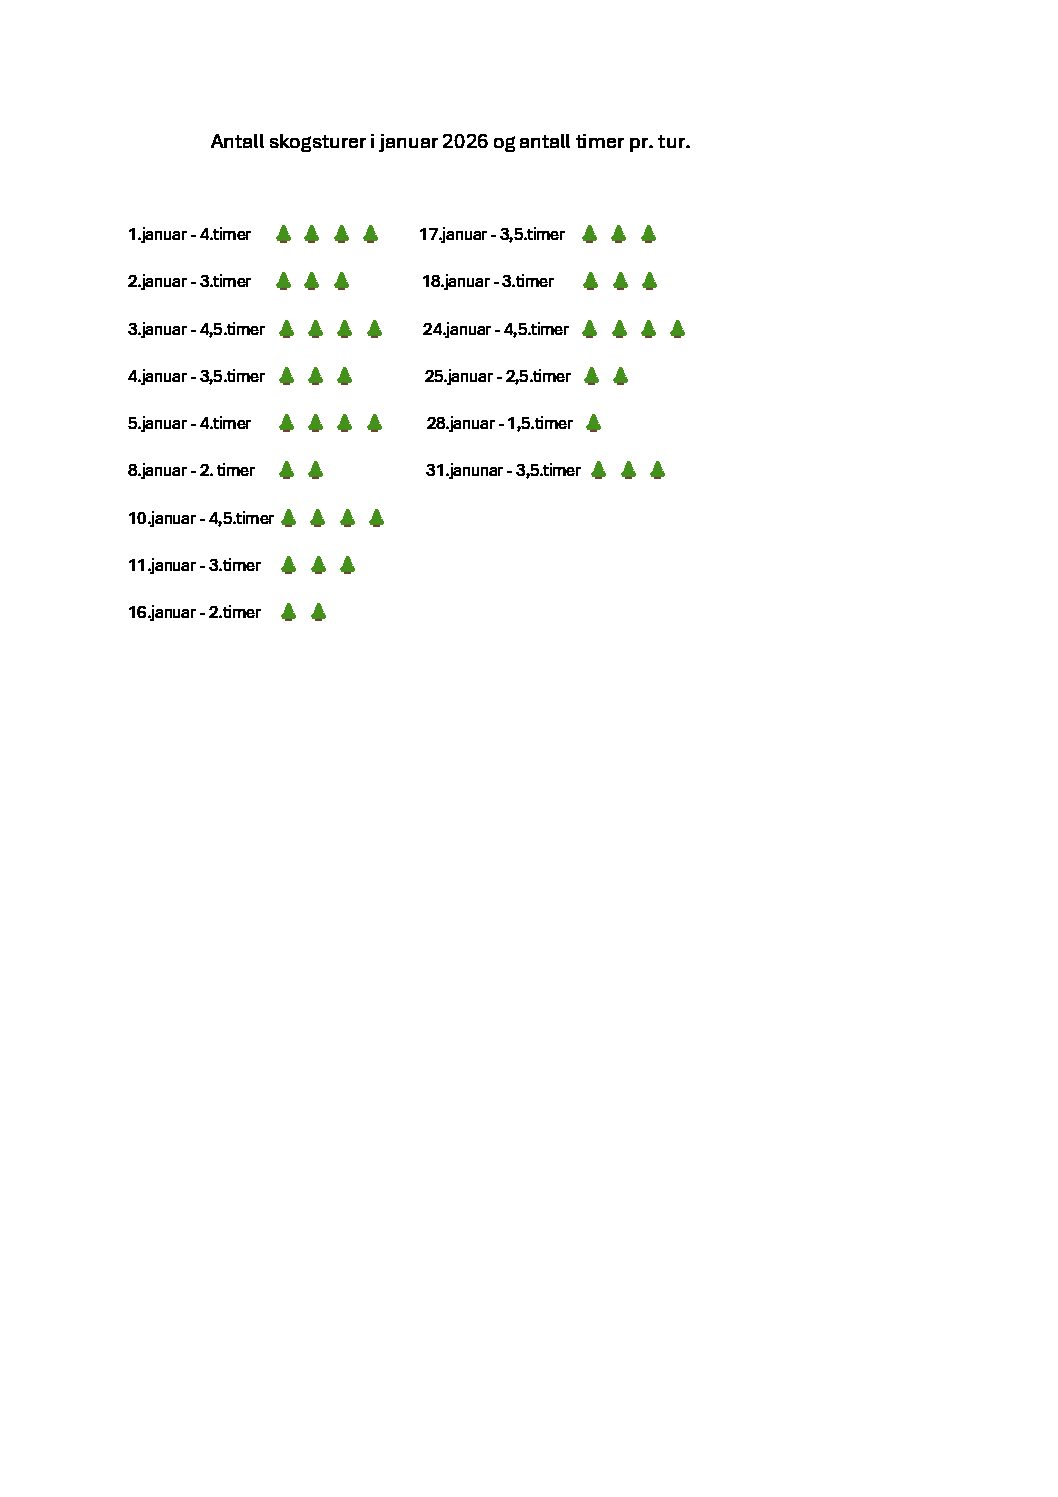
Dette er en oversikt over mine antall skogsturer i januar 2026 og hvor lenge turene varte. Trærne representerer antall hele timer i skogen.
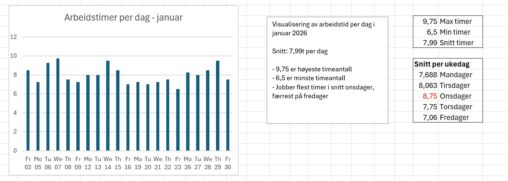
Visualisering av arbeidstid per dag i januar 2026 Analyse av data: Snitt: 7,99t per dag – 9,75 er høyeste timeantall – 6,5 er minste timeantall – Jobber flest…
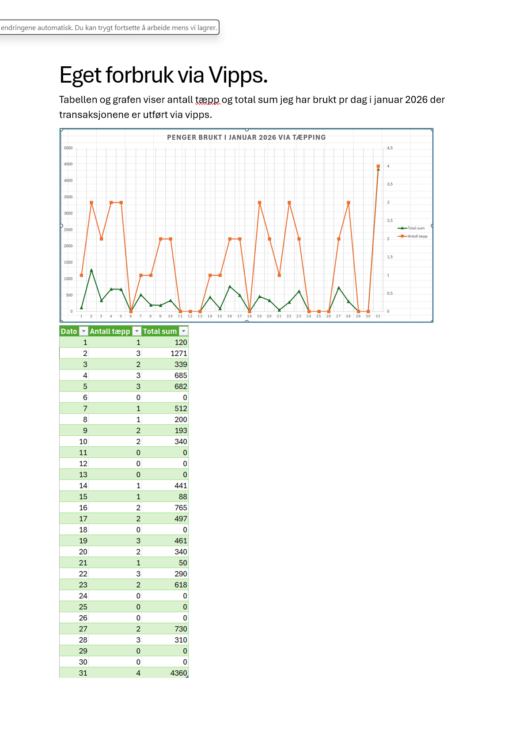
Excel graf og tabell laget av data tatt fra egen vippsapp. Visualisert med totalsum og antall tæpp pr dag i januar 2026.
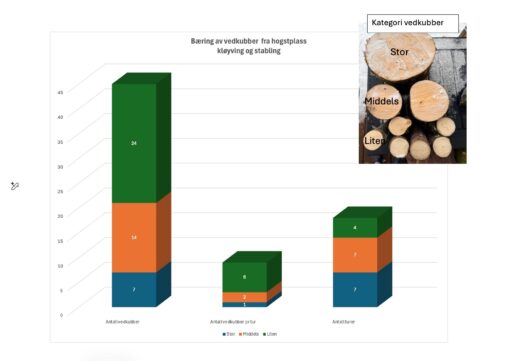
Bildet viser antall turer med bæring av vedkubber fordelt på kategorier av vedkubber. 1 stor vedkubbe = 1 tur 2 mellomstore vedkubber = 1 tur 6 små vedkubber…
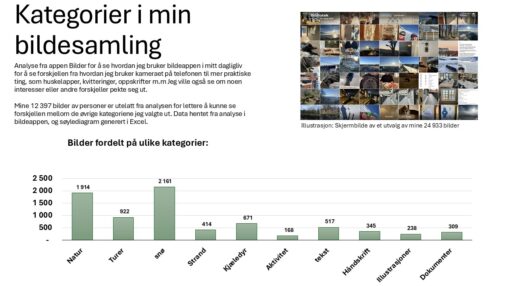
A presentation of the different categories of photos on my Iphone. Data is collected from my photo collection on my Iphone and the datas in the analysis are…

Klæbo skiatlon 20 km VinnerLøp Slutt Tid 46.11.0 Dato 10 Feb OL 2026 Italia
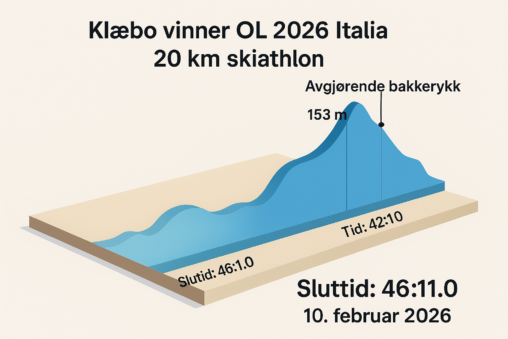
Klæbo skiatlon 20 km VinnerLøp OL 2026 Italia Dato 10 Feb 2026 Italia Slutt Tid 46.11.0
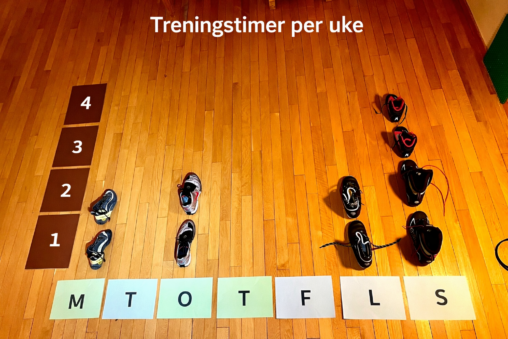
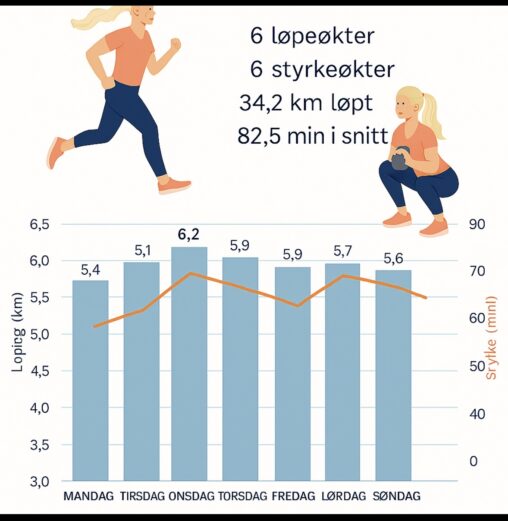
Dette er en visualisering av hvordan en vanlig treningsuke ser ut i vinter. Det er et stolpediagram der x-aksen er ukedager og Y-aksen er antall timer per dag….
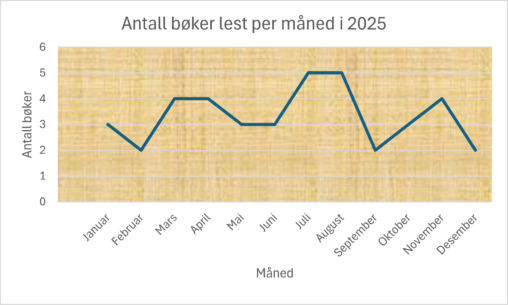
Eget produsert og visualisert data basert på hvor mange bøker jeg har lest i løpet av 2025, fordelt per måned. Målet var å vise utvikling over tid
Jeg har produsert og visualiserte hvor mange bøker jeg har lest i løpet av 2025, fordelt per måned. Målet var å vise utvikling over tid. Produsert av Isabel….
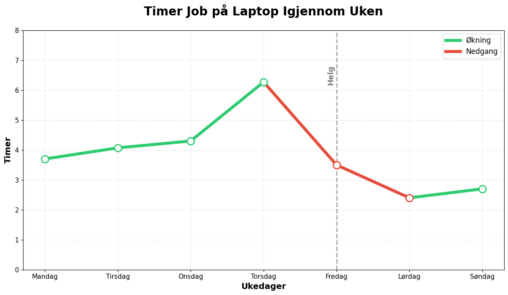
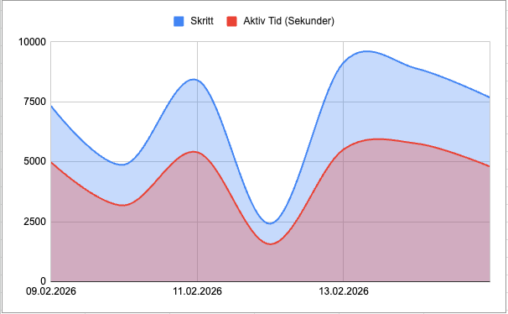
Grafen er en visualisering skjermtiden jeg har hatt på laptopen min den siste uken. Den gir et godt bilde av hvor mye jeg har arbeidet med studier, siden…
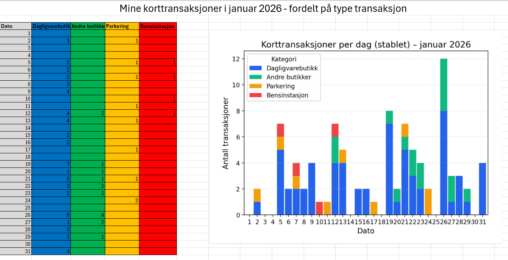
En visualisering av korttransaksjoner fra min brukskonto i januar 2026. Transaksjonene er gruppert etter hva de omhandler.
En visualisering av korttransaksjoner fra min brukskonto i januar 2026. Transaksjonene er gruppert etter hva de omhandler.