
1050 Data visualizations Categorized "my city in data" (page 6 of 53)
Open Goverment Licence
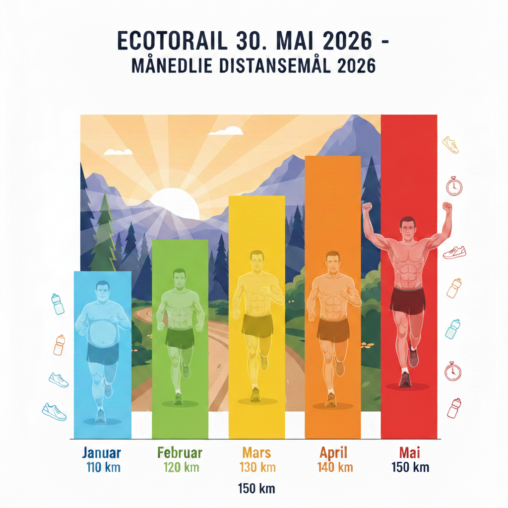
Diagrammet representerer månedlige distansemål i forkant av deltagelse på Ecotrail 30. mai 2026 der en jevn økning i mengde skal sikre suksess under løpet. Hver søyle representerer hver…

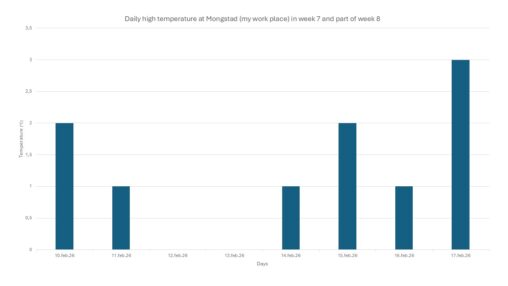
What is visualized is the observed maximum daily temperature (in degree celsius) at Mongstad where I work. The readings were taken from screen displaying temperatures at TCM. The…
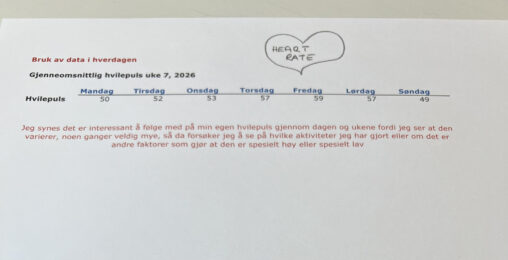
Dette er en oversikt over min gjennomsnittlig hvile puls uke 7 i 2026 med dagene vannrett bortover og resultatet for gjennomsnittlig hvile puls under hver dag.
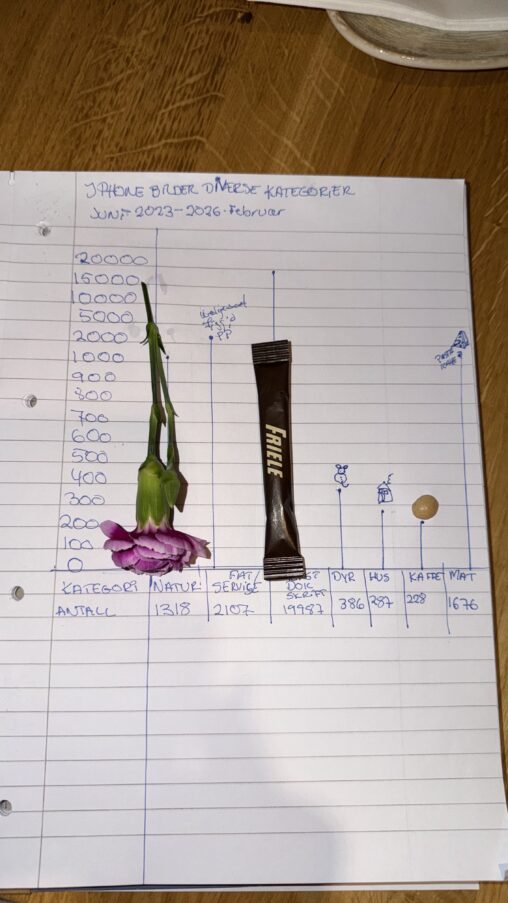
Finne ut hvilken kategori som var størst i diagrammet av ulike kategorier på mine bilder- iPhone levetid fra Juni2023-Februar2026. Kategorier: Natur,Fat/ servise, tekstdokument-skrift, hus, dyr,kaffe, mat
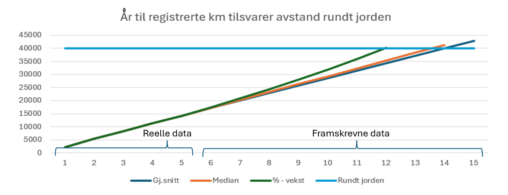
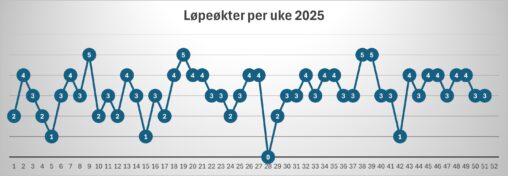
De 5 første årene inneholder registrerte kilometer på treningsklokke. Basert på disse dataene vises framskrivninger med ulike metoder.
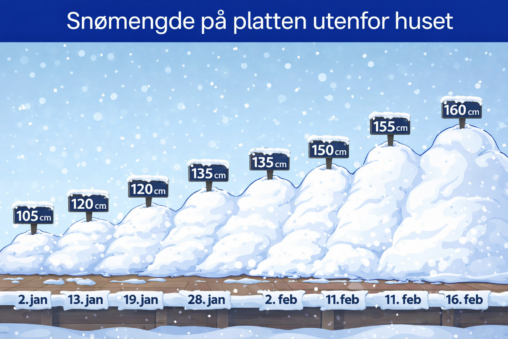
The representation is my own measurements of how much snow is on the terrace outside my house in Tromsoe, Northern Norway, in January and February. The owner of…
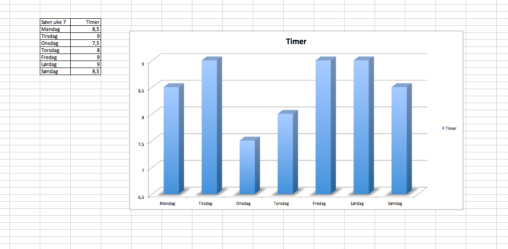
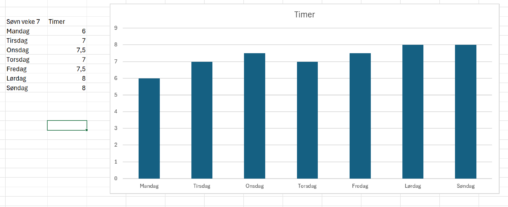
Det er en oversikt over hvor mange timer jeg såv hver natt i uke 7. Dagene er nede på diagrammet. Jeg har delt de inn i hele og…
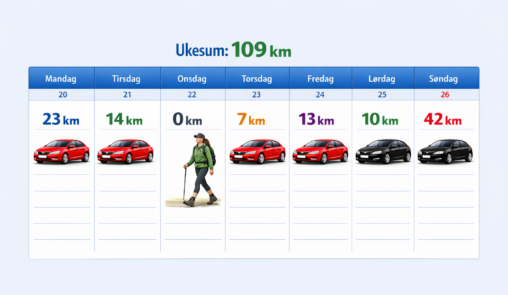
Oversikten viser bilbruk, men forklarer også hvorfor det er kjørt 0 km onsdag.
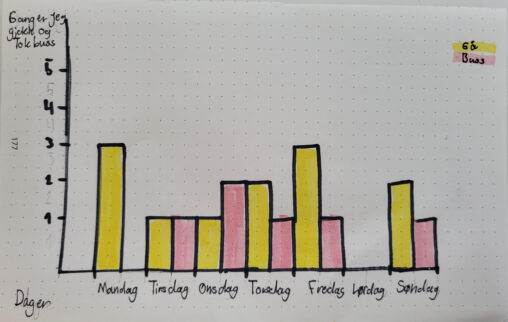
Visualiserer hvor mange ganger jeg gjekk og eller tok buss til og fra hjemme.
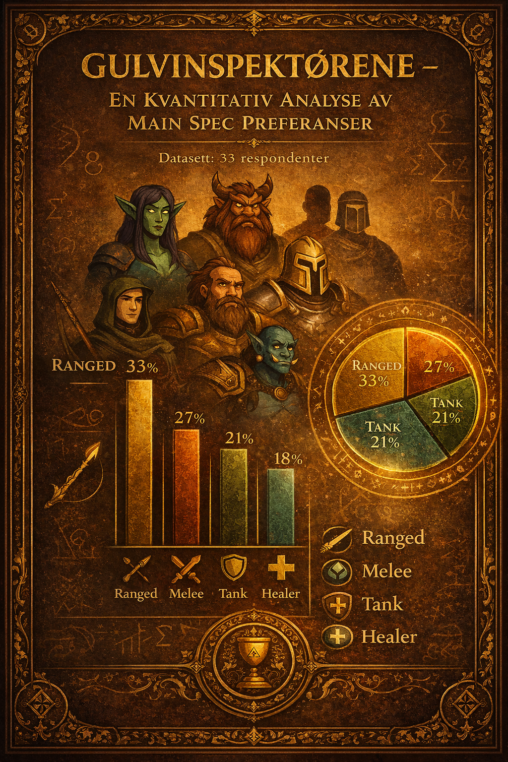
Som raidleder i Gulvinspektørene har jeg ansvar for å holde oversikt over hvilke roller spillerne tar i Midnight. Før vi går løs på kveldens utfordringer, sjekker jeg at…