
1048 Data visualizations Categorized "my city in data" (page 52 of 53)
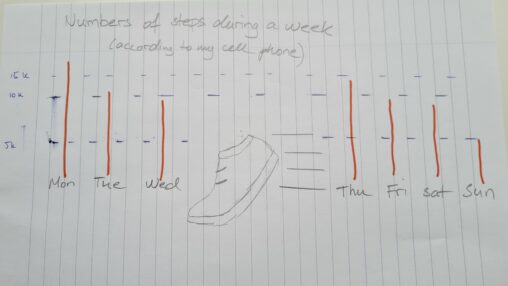
Numbers of steps during a week (according to my cell phone)
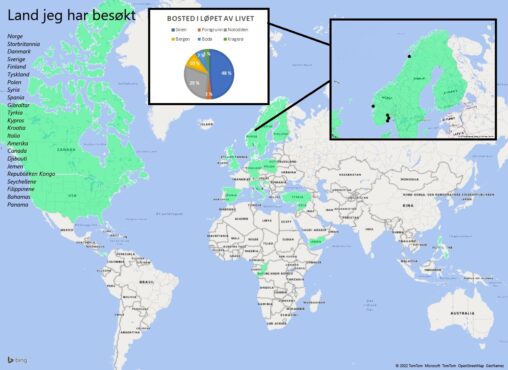
The data have been plotted into “Microsoft Excel”, and converted over to “Excel 3D map”. Tha data contains the countries I’ve visited, and places I’ve lived. I then…
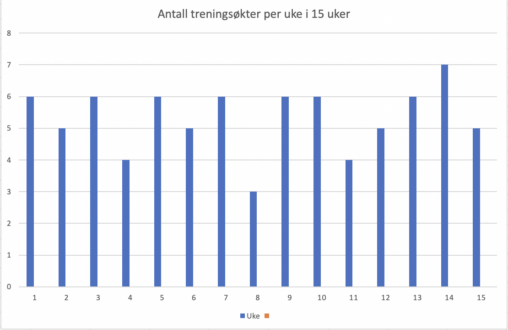
Dette er en oversikt over hvor mange ganger jeg har trent på Sammen treningssenter i bergen over de siste 15 ukene og hvor mange ganger i uka jeg…
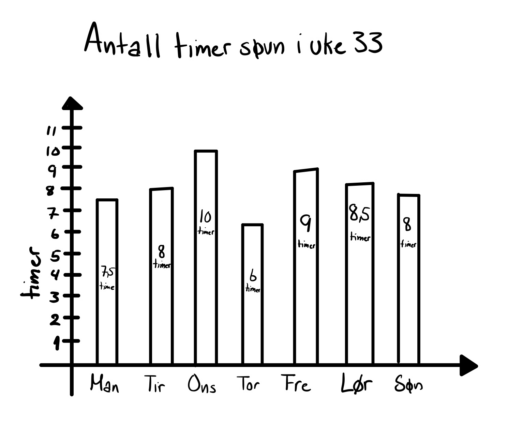
Antall timer søvn jeg har fått mandag til søndag i uke 33, 2022.
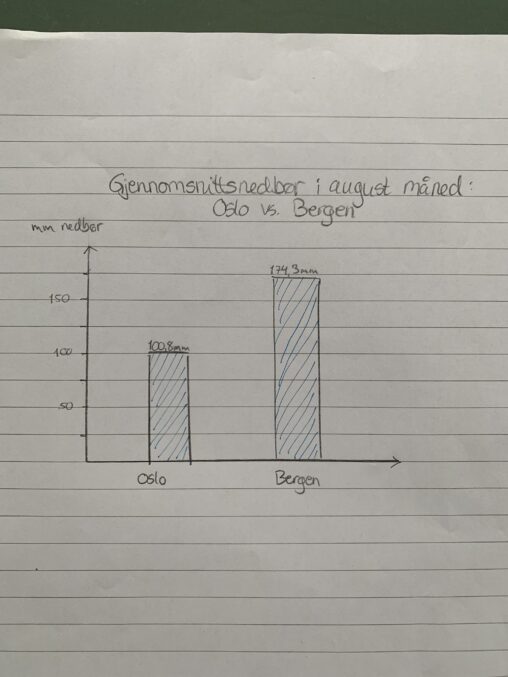
Representert er gjennomsnittlig nedbørsmengde i august måned i Oslo (100,8mm) og Bergen (174,3mm). Dataen er hentet fra timeanddate.

Visualiserer den totale nedbørsmengden i Bergen de siste 12 månedene (August 2021-Juli 2022). Dataene er hentet fra yr.no sine sider: https://www.yr.no/nb/historikk/tabell/1-92416/Norge/Vestland/Bergen/Bergen?q=siste-13-m%C3%A5neder
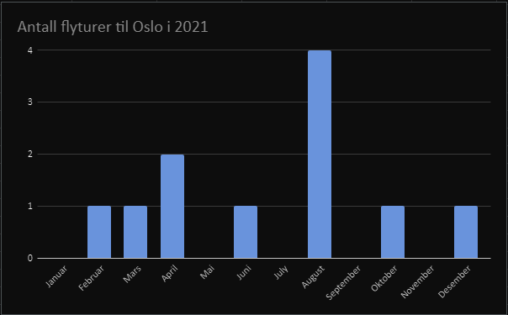
Antall flyvninger jeg har tatt til Oslo gardemoen flyplass i året 2021.
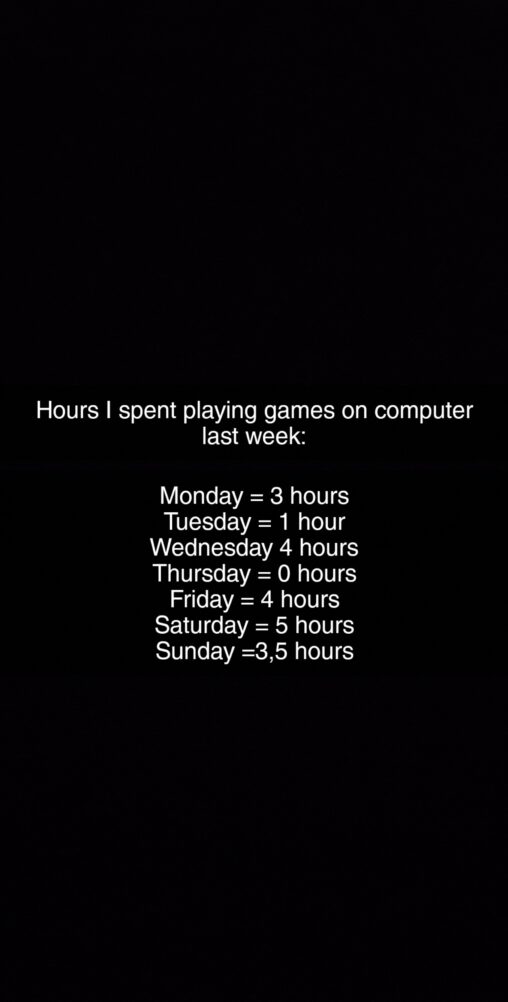
Hours I spent playing games on computer last week: Monday = 3 hours Tuesday = 1 hour Wednesday 4 hours Thursday = 0 hours Friday = 4 hours…
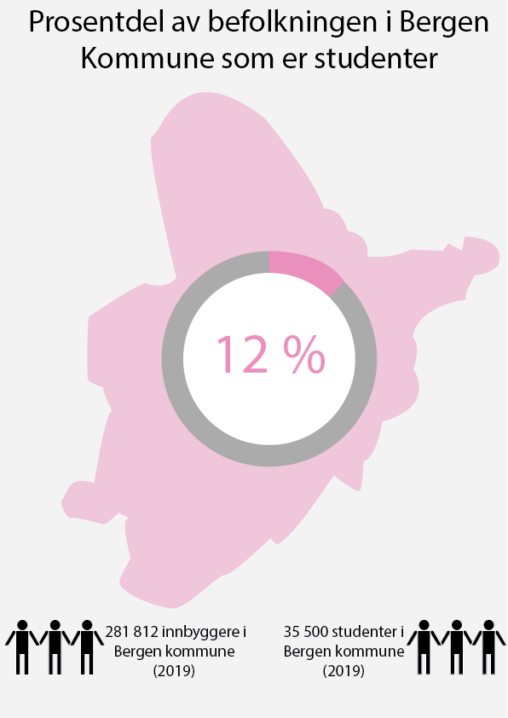
En fremvisning av hvor mange studenter som bor i Bergen Kommune.
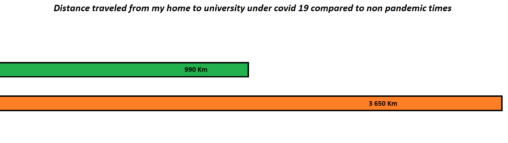
Under covid 19 pandemic I hade a lot of digital classes witch cutdown on the times I hade to travel form my home to university. This is a…
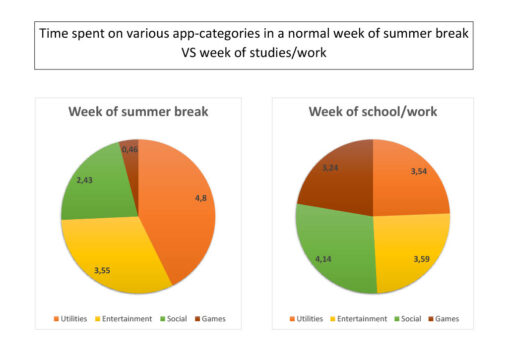
This is two diagrams that show the difference between time spent on various app-categories on my phone in a average week of summerbreak versus a average week of…

Average rainfall for each month in Sandnes for the years 1985-2015. Data available from timeanddate.com.
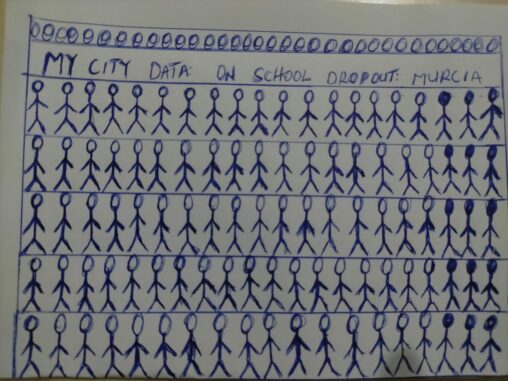
SCHOOL DROPOUT IN THE REGION OF MURCIA IS 16.3%. 2020 STATISTICS. ALSO IS THE SIXTH OUT OF THE TOTAL SEVENTEEN AUTONOMOUS COMMUNITY AND TWO AUTONOMOUS CITY, CEUTA AND…

This graphic shows how I spend my free time. There are five categories: Family and friends (35%), Computer/Phone (25%), Music and movies (20%), Sport (15%) and Other things…
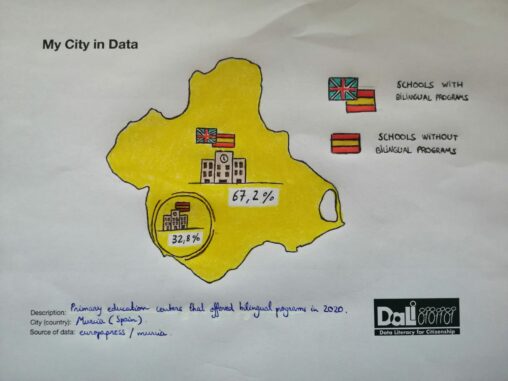
This data visualization represents the percentage of schools which had bilingual programs in the Region of Murcia in 2020.
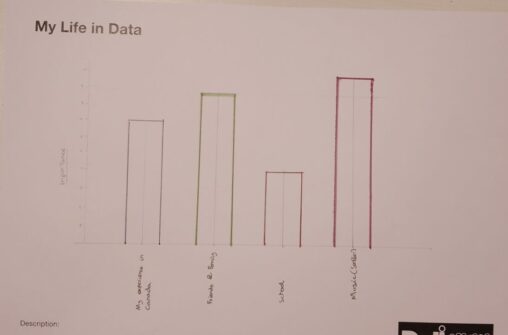
A graph that shows different moments and things that I hold dear or that affect me in some way, I then place a value from 1-10 (1 least…
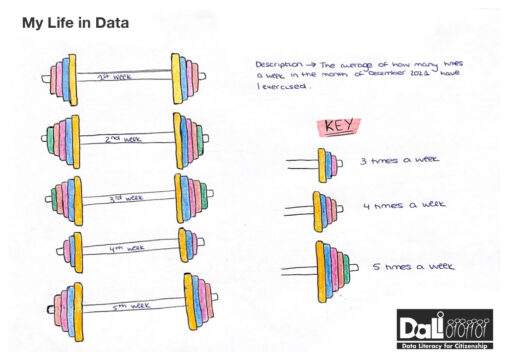
the average of how many times a week in the month of December 2021 have I exercised. You can see during each week the days that I have…

In this picture it is represented the most famous monument located in Murcia, the Cathedral. It is located in the center of Murcia and is an extremely characteristic…