
1048 Data visualizations Categorized "my city in data" (page 51 of 53)
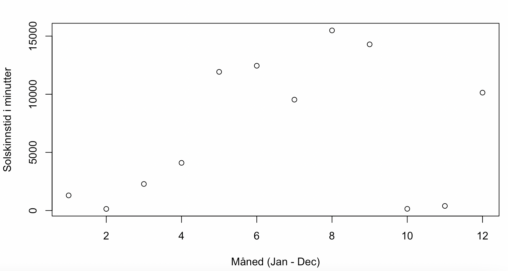
This data represents the total amount of sunshine in city full of rain. The data used is from the Geophysical Institute at the University in Bergen.
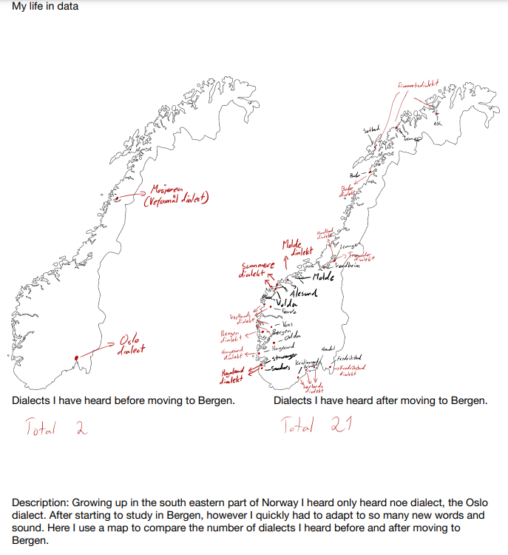
The illustration shows to maps of the country of Norway. The one on the left represensts the total number of dialects I encountered growing up, living on the…


This Image shows the average temperature of my hometown Osøyro so far through 2022. Instead of using numbers, it is color-coordinated. I used yr.no as my source.
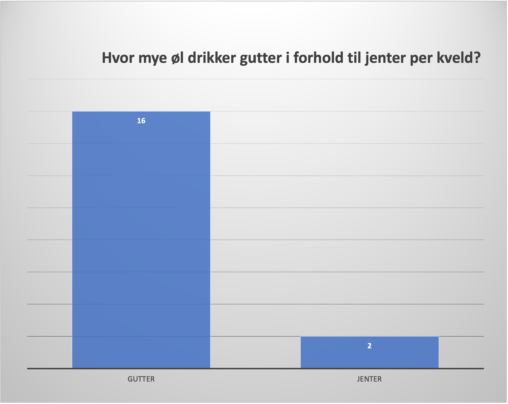
10 boys and 10 girls have been asked how many beers (o.33l) they drank the last time they went to a party.
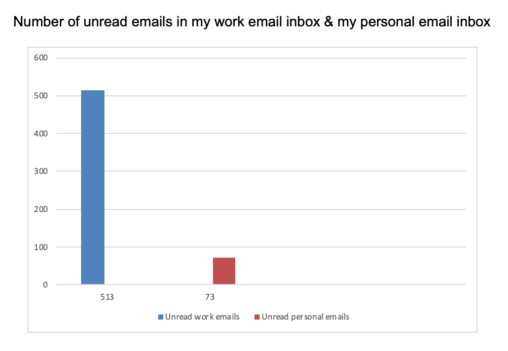
Number of unread emails in my work email inbox & my personal email inbox, August 29, 2022
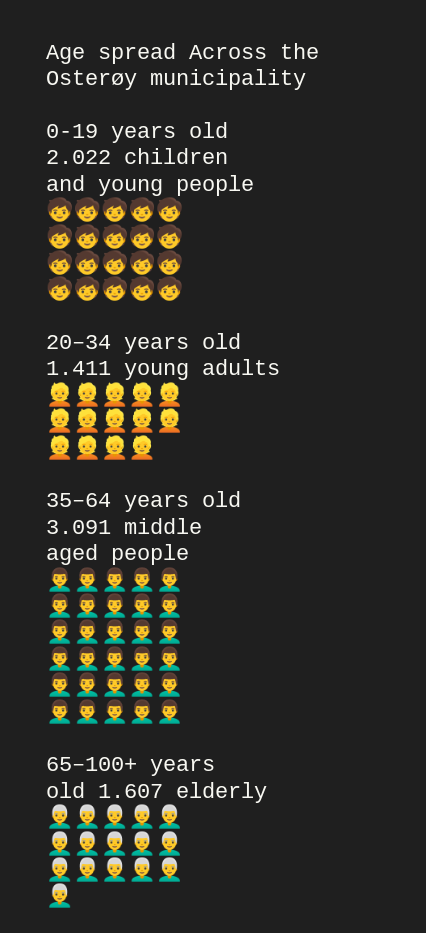
Visual emoji style count (hundreds) of age spread <link url="https://www.ssb.no/kommunefakta/osteroy" text="SSB Data Source"]
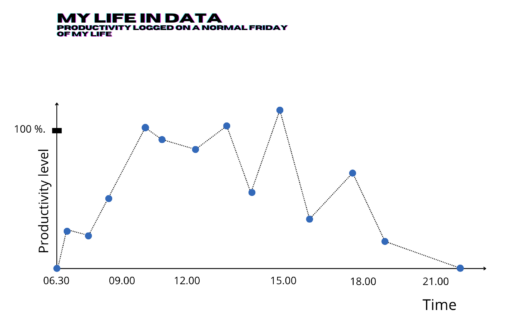
Productivity logged from the time I woke up to when I went to bed on Friday 26.08.2022. The productivity level also reflects the level of energy at various…
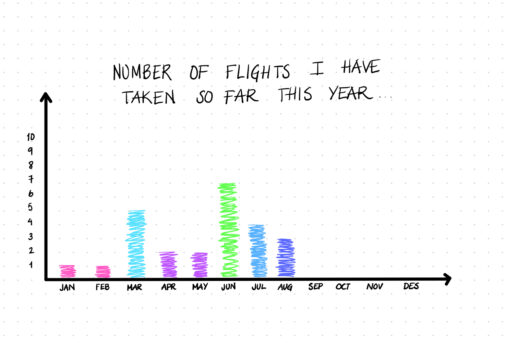
Visualiserer hvor mange flyvninger jeg har tatt så langt i løpet av 2022.
Here you can see how many minutes I have spent on my phone during the last week and what I aspect used the phone for.
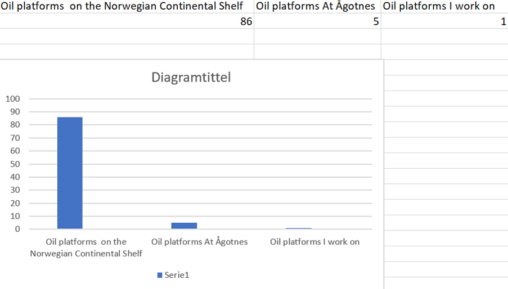
There are 86 oil platforms on the Norwegian Continental Shelf. Ågotnes located on Sotra have 5 oil platforms at dock per at the moment (28.08 2022). 1 of…

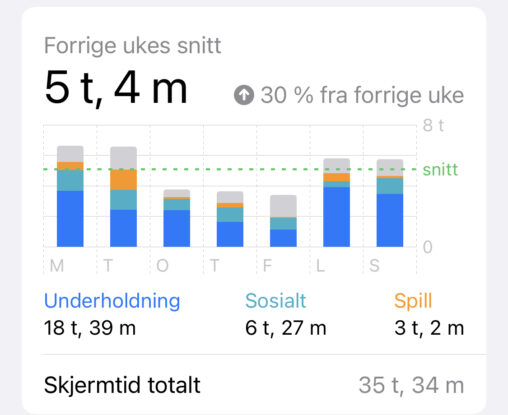
Bildet viser gjennomsnittlig skjermtid brukt denne uken, sammenlignet med uken før. I tillegg fordeler den antallet timer etter kategori. Til slutt ser du en total antall timer brukt…
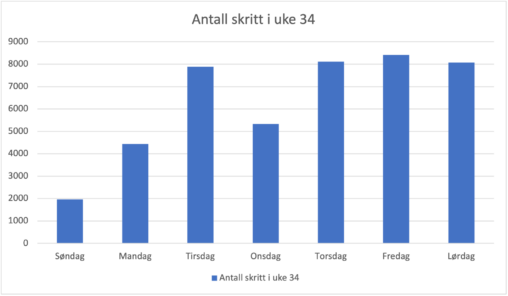
Livet mitt i data: oversikt over antall skritt jeg har gått i uke 34
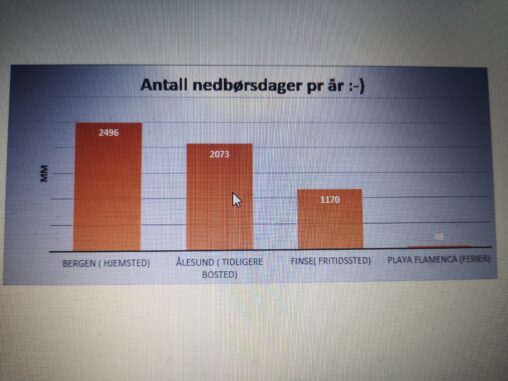
Nedbørsdager. Sammenligning mellom ulike aktuelle steder.