
1051 Data visualizations Categorized "my city in data" (page 5 of 53)
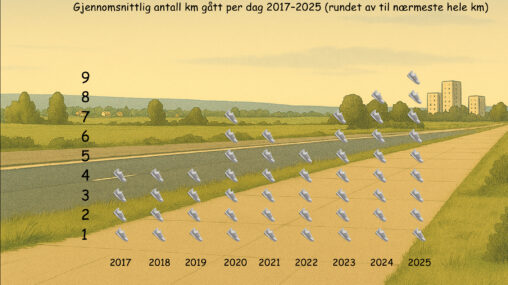
This data visualisation illustrates my average number of kilometres walked per day as registered by the health app on my Apple iPhone from 2017 to 2025. The actual…
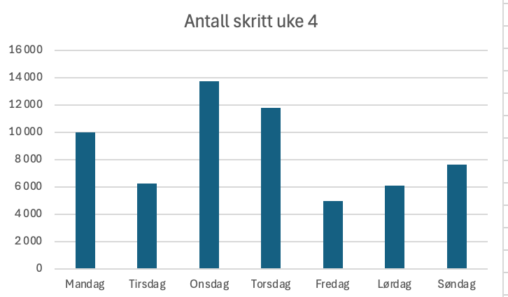
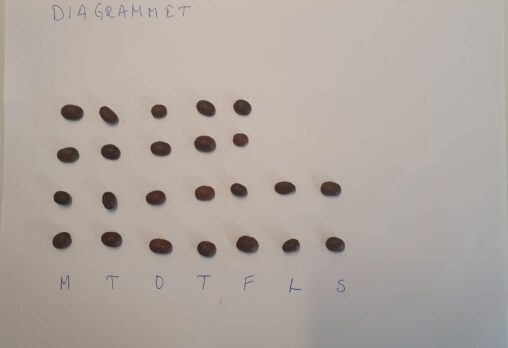
Oversikt over antall skritt jeg har gått per dag i uke 4. Dataene er registrert av en app på telefonen, deretter lagt inn i excel som laget et…
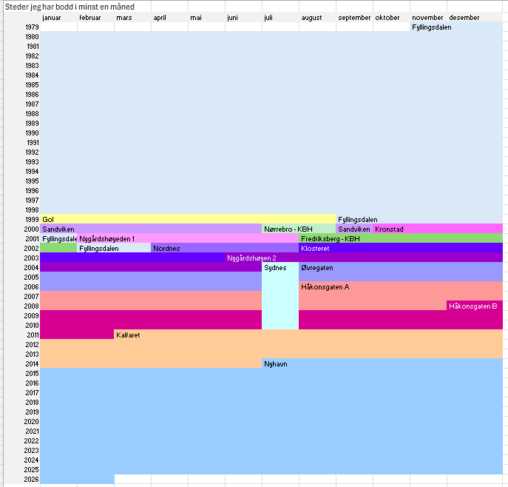
I have created I timeline for places I have lived for at least a month. I have colour coded the different abruptions, and also tried to use a…
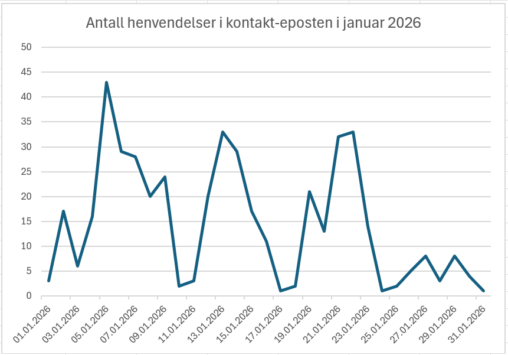
Linjediagram som viser antall henvendelser til en kontakt-innboks ved et universitet i januar. Visualiseringen kan blant annet brukes til å si noe om når det er mest aktivitet…
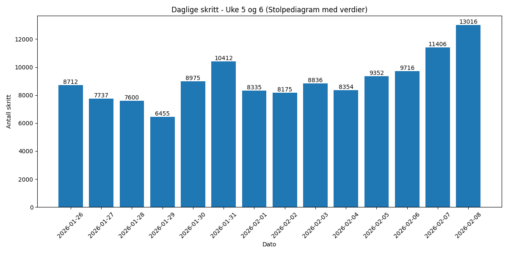
Beskrivelsen er en oversikt over antall skritt jeg har gått i uke 5 og 6 2026. Skrittene er registrert på Min Garmin Venu 4 klokke. Jeg registrerte dette…
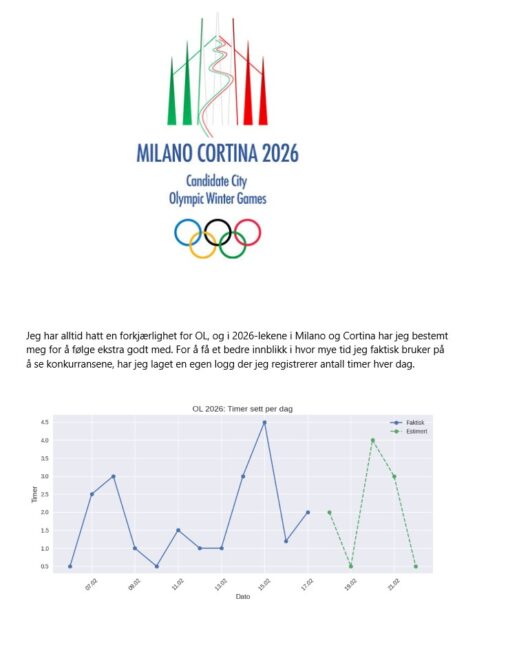
Jeg har alltid hatt en forkjærlighet for OL, og i 2026 lekene i Milano og Cortina har jeg bestemt meg for å følge ekstra godt med. For å…
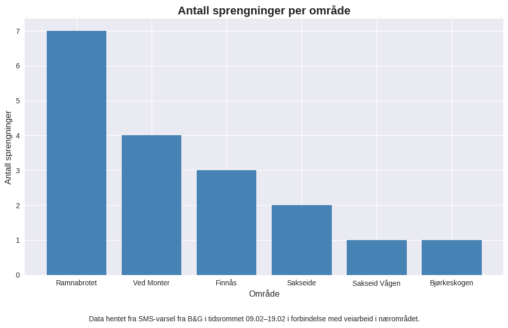
Visualisering av sprengning i forbindelse med veiarbeid i nærområdet. Basert på SMS varsling fra B&G
Antall sprengninger fordelt på lokalt område. Data fra SMS er lagt inn i Excel og det ble laget en visualisering av dette.
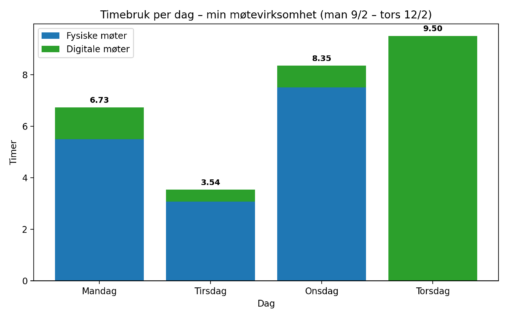
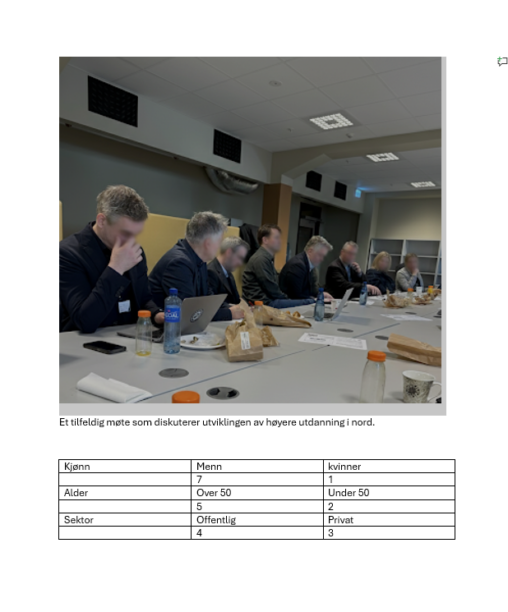
Jeg har samlet data over møtevirksomheten min på jobb i perioden 9.-12. februar 2026, og instruert et KI-verktøy (Copilot) til å hente ut disse dataene fra kalenderen min…
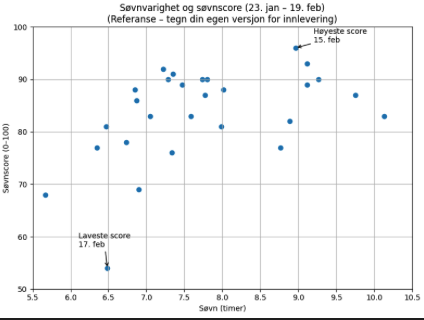
Visualiseringen viser min registrerte søvn i perioden 23. januar–19. februar. Hvert datapunkt representerer én natt og viser forholdet mellom søvnvarighet (timer og minutter omregnet til timer på x-aksen)…
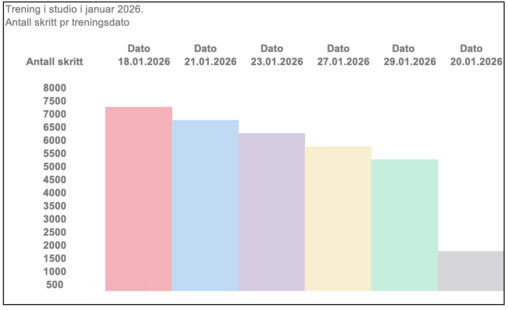
SPENST PROVIDED DATA ON dates I attended the studio. My Oura Ring 4 provided steps per work out session in January
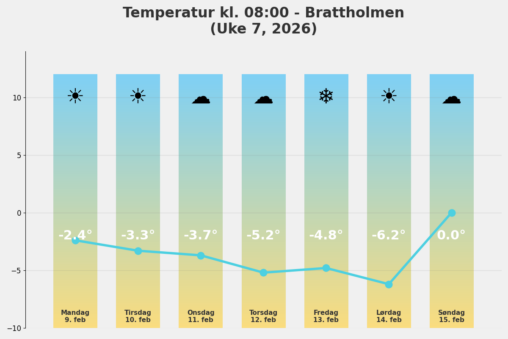
Diagrammet over viser observasjon av temperaturer i Brattholmen, Øygarden kommune uke 7, ca klokken 08:00. Temperatur ble lest av på privat temperaturmåler. Det var kaldt og forholdsvis pent…
Dataene som visualiseres er egenproduserte hverdagsdata samlet inn manuelt av meg, Vito Rodrigo Salvatore San Martin. Jeg har totalt 500 studiepoeng og deltar i prosjektet En reise i…

Dette er en visualisering av antall innlegg Eline har publisert på LinkedIn i 2026 og hvordan de er fordelt mellom video og bilde innlegg
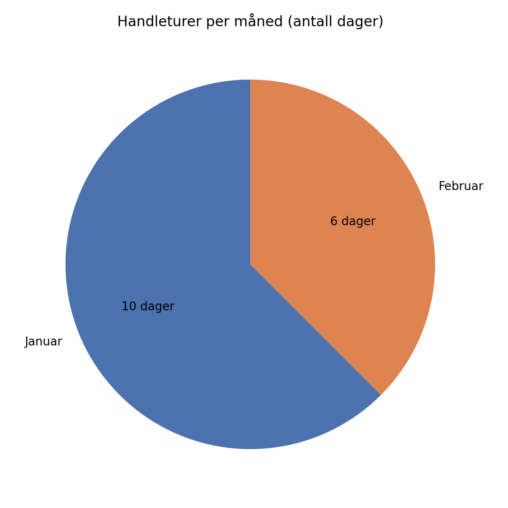
Dataene er hentet fra kvitteringer hos en dagligvarekjede. Diagrammet viser at jeg har handlet 10 dager i januar, og 6 dager i februar (så langt).
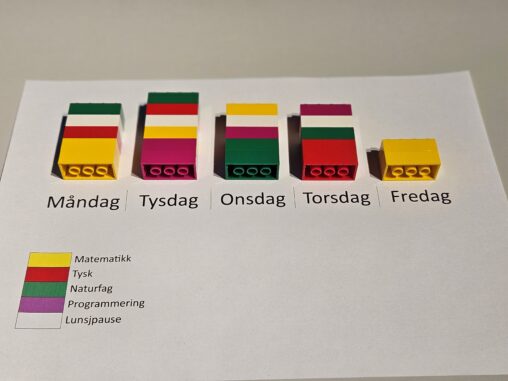
Eg er lærar på ein ungdomsskule, og her er timeplanen min for skuleåret 2025/26. Eg har visualisert han med LEGO-klossar, sidan LEGO er sentralt i programmeringstimane mine, der…

Diagrammet over viser observasjon av temperaturer i Brattholmen, Øygarden kommune uke 7, ca klokken 08:00. Temperatur ble lest av på privat temperaturmåler. Det var kaldt og forholdsvis pent…
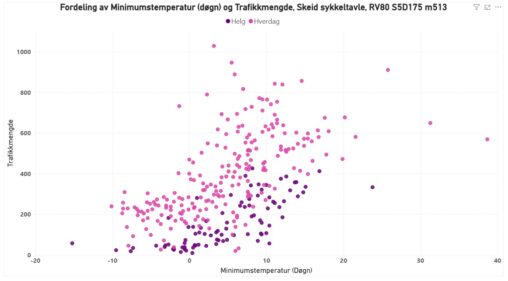
Grafen viser fordeling av minimumstemperatur (døgn) og Trafikkmengde (sykkel) i et sykkeltellepunkt i Bodø for 2025. Y aksen viser antallet sykkelpasseringer i gjennom et sykkeltellepunkt i Bodø. X…
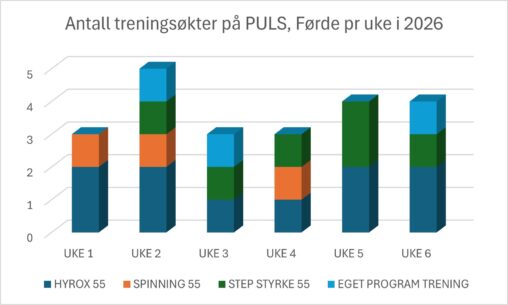
Mine egne data med oversikt over hvilke treningstimer jeg har deltatt på pr uke hittil i 2026
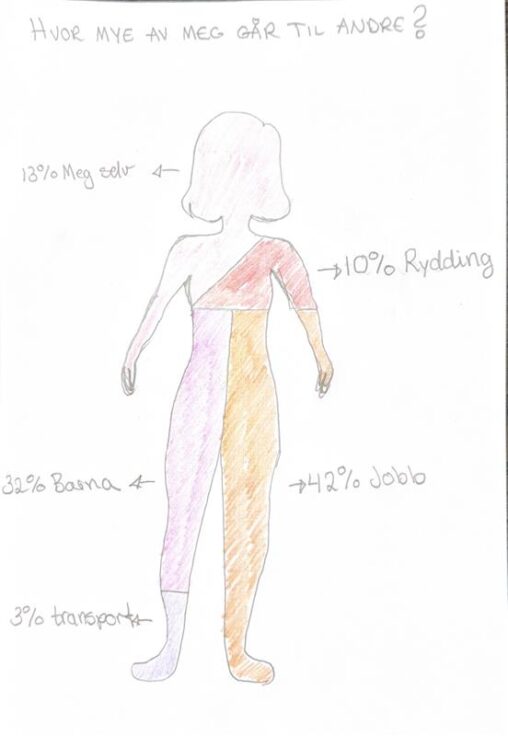
Hvor mange prosent av en uke – minus søvn bruker jeg på andre/andre ting enn meg selv.