
1048 Data visualizations Categorized "my city in data" (page 40 of 53)
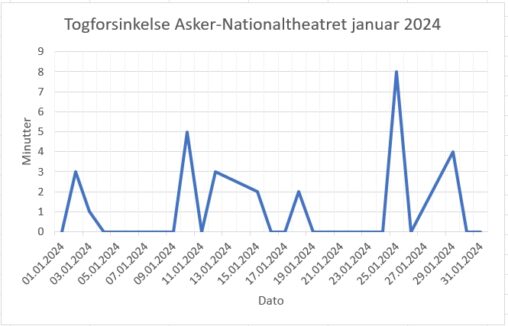
Linjediagram som viser antall minutter toget “mitt” var forsinket hver morgen på strekningen Asker-Nationaltheatret i januar 2024
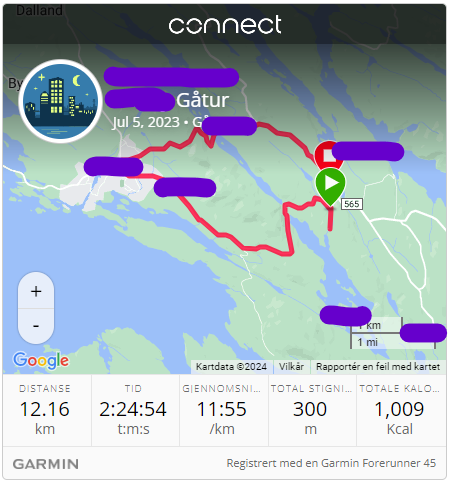
Gårturen denne onsdagen varte i 2 timer 24 minutter og 54 sekunder. Turen ble registrert ved bruk av min GPS klokke av merke GARMIN Forerunner 45. Jeg gikk…

Tegningen viser resultater for nasjonale prøver i engelsk, lesing og regning på 5. trinn i skoleåret 2023/2024 i Arendal. Data publiseres av Udir og viser poeng i engelsk,…
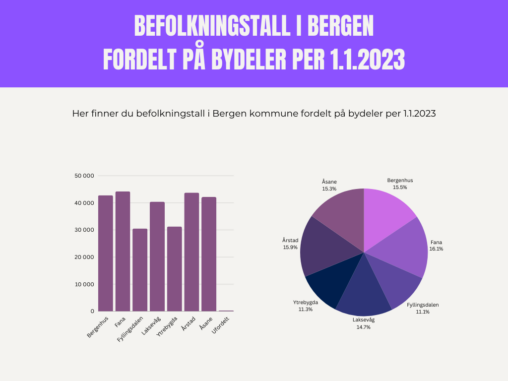
Befolkningstall fordelt på bydeler i Bergen per 1.1.2023 basert på tall fra SSB.
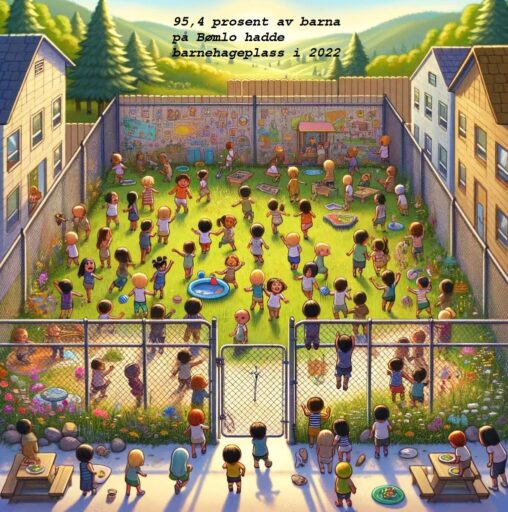
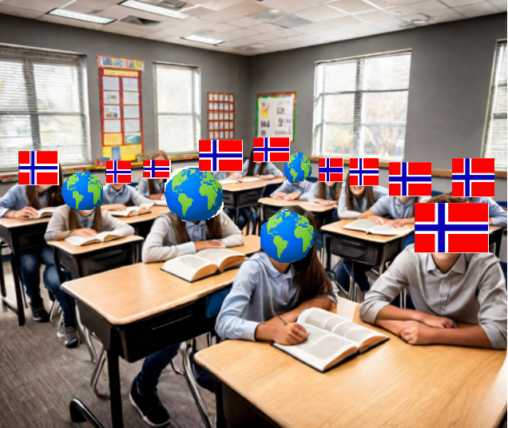
Data fra SSB. statistisk sentral byrå. Viser at 95.4 barn i barnehagealder hadde plass ibarnehager i Bømlo i år 2022.
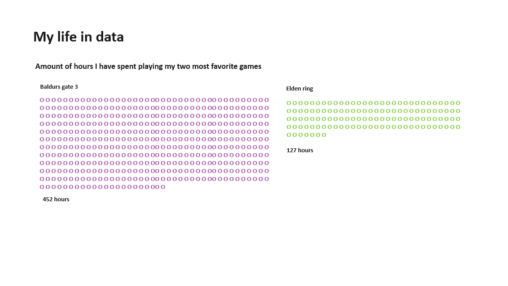
Hours spent playing my favorite games represented by circles.
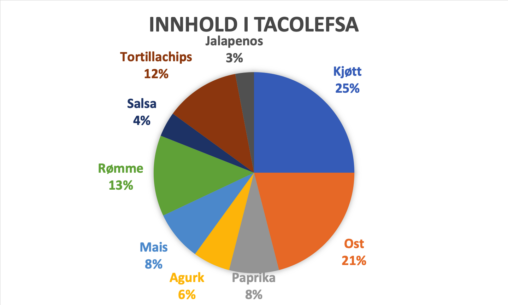
Her er forholdet mellom ingrediensene jeg hadde på tacolefsa mi idag. Dette er det beste forholdet for det beste resultatet.

Grafen viser fordelingen av utenlandske besøkende til Bergen, basert på deres nasjonalitet. USA, Tyskland og Storbritannia utgjør mer enn en tredjedel av de utenlandske besøkende til Bergen, og…

This data shows the amount of times I worked out in the last 24 weeks.
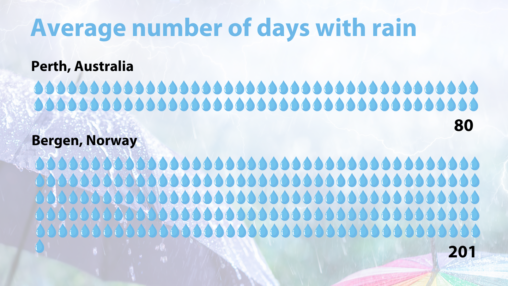
Comparison of the average number of days with rain in my hometown Perth, Australia and Bergen, Norway.

Hvor ofte man gjør treningsaktiviteter etter alder i Norge i 2021 Visualisering av hvor ofte folk i Norge gjorde treningsaktiviteter i 2021. Data hentet fra SSB (Statistisk sentralbyrå).
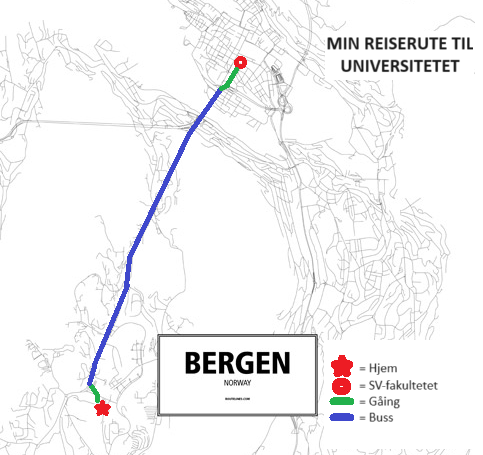
My travel route from my home to the SV-faculty at University of Bergen (EnTur.no, 6. february 2024)
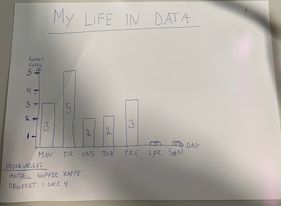
Grafen viser antall kopper kaffe drukket i uke 4 2024 X-aksen representerer dager Y-aksen angir enheten kopper kaffe. Datamaterialet er basert på egen erfaring av antall kopper kaffe…

Bilde laget av chatGPPT sin image generator, på bakgrunn av statistisk sentralbyrå sin kommunefakta som beskriver at det i år 2022 var 95.4 barn som hadde barnehageplass i…

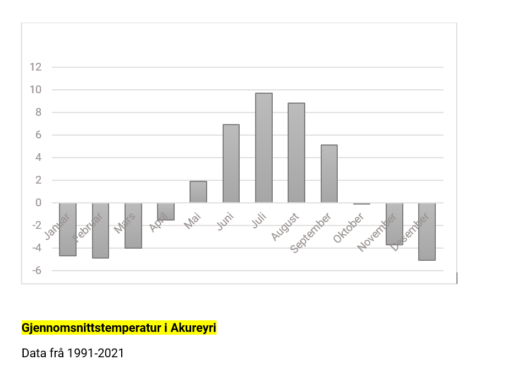
Oversikt over nedbøren i Samnanger kommune de siste 13 mnd. Fra januar 2023 til januar 2024. Opphavsrettstatus: Opphavsrett © NRK og Meteorologisk institutt 2007–2024 Eier av data: Yr…
I denne datavisualiseringen viser nedbørs mengden målt i millimeter i løpet av de siste 13 måneder. Fra januar 2023 til januar 2024. Kommunen heter Samnanger, og ligger ofte…
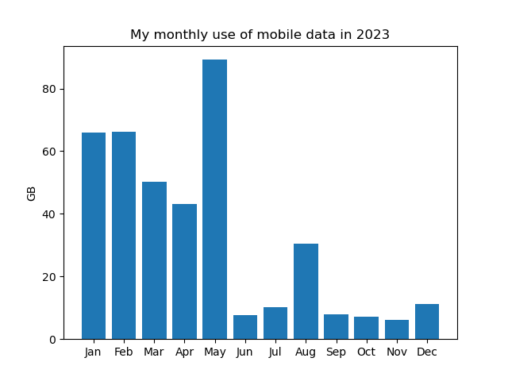
My monthly use of mobile data varies a lot – in November I only used 6.1 GB and in May I used 89.2 GB. During the spring semester…
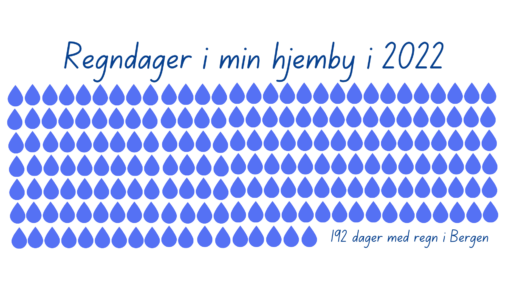
Regndager i min hjemby i 2022. Antall dråper viser antall regndager i Bergen i 2022.