
1050 Data visualizations Categorized "my city in data" (page 4 of 53)
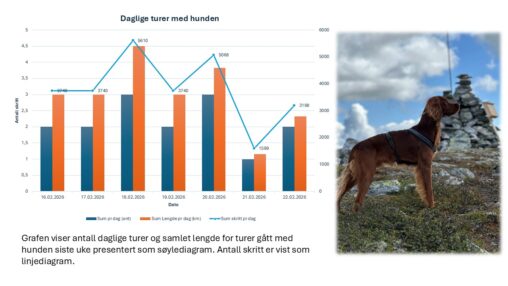
Har samlet data i uke 8 (16-22 februar) på følgende: – antall turer jeg har gjennomført med min hund – antall skritt jeg har gjennomført med min hund…
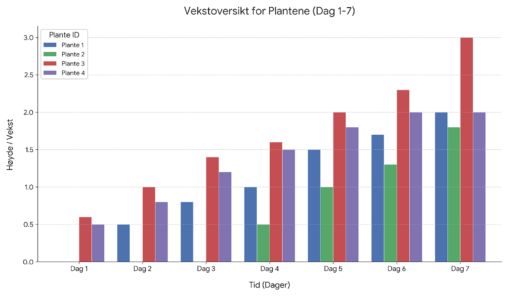
Stolpediagrammet viser veksten til 4 agurkplanter over en periode på 7 dager. Dataene viser akkumulert vekst for hver dag.
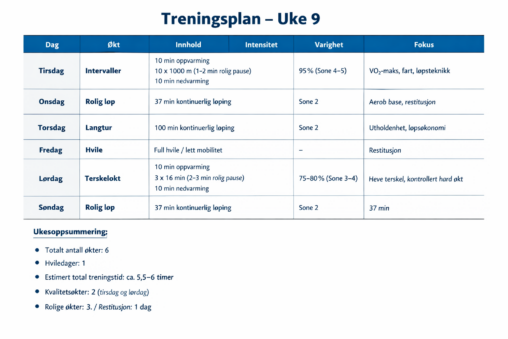
Her har jeg lagt data inn i chat gpt angående en treningsuke jeg har hatt. Jeg skrev dette inn for å få den til å visualisere dataene inn…

Dette er et bilde av strikkemønster på en strikket sokk. Hver maske er et datapunkt. Visualiseringen skal hjelpe til med å planlegge fasong, symmetri og forklare mønsteret visuelt…
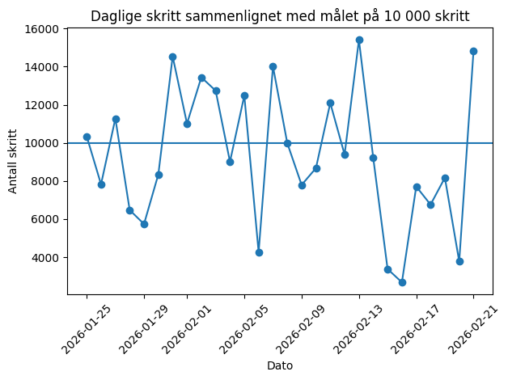
Bildet viser daglige skritt vs. 10 000-skrittsmålet mitt. • X-aksen viser datoene fra 25. januar 2026 til 21. februar 2026. • Y-aksen viser antall skritt per dag. •…
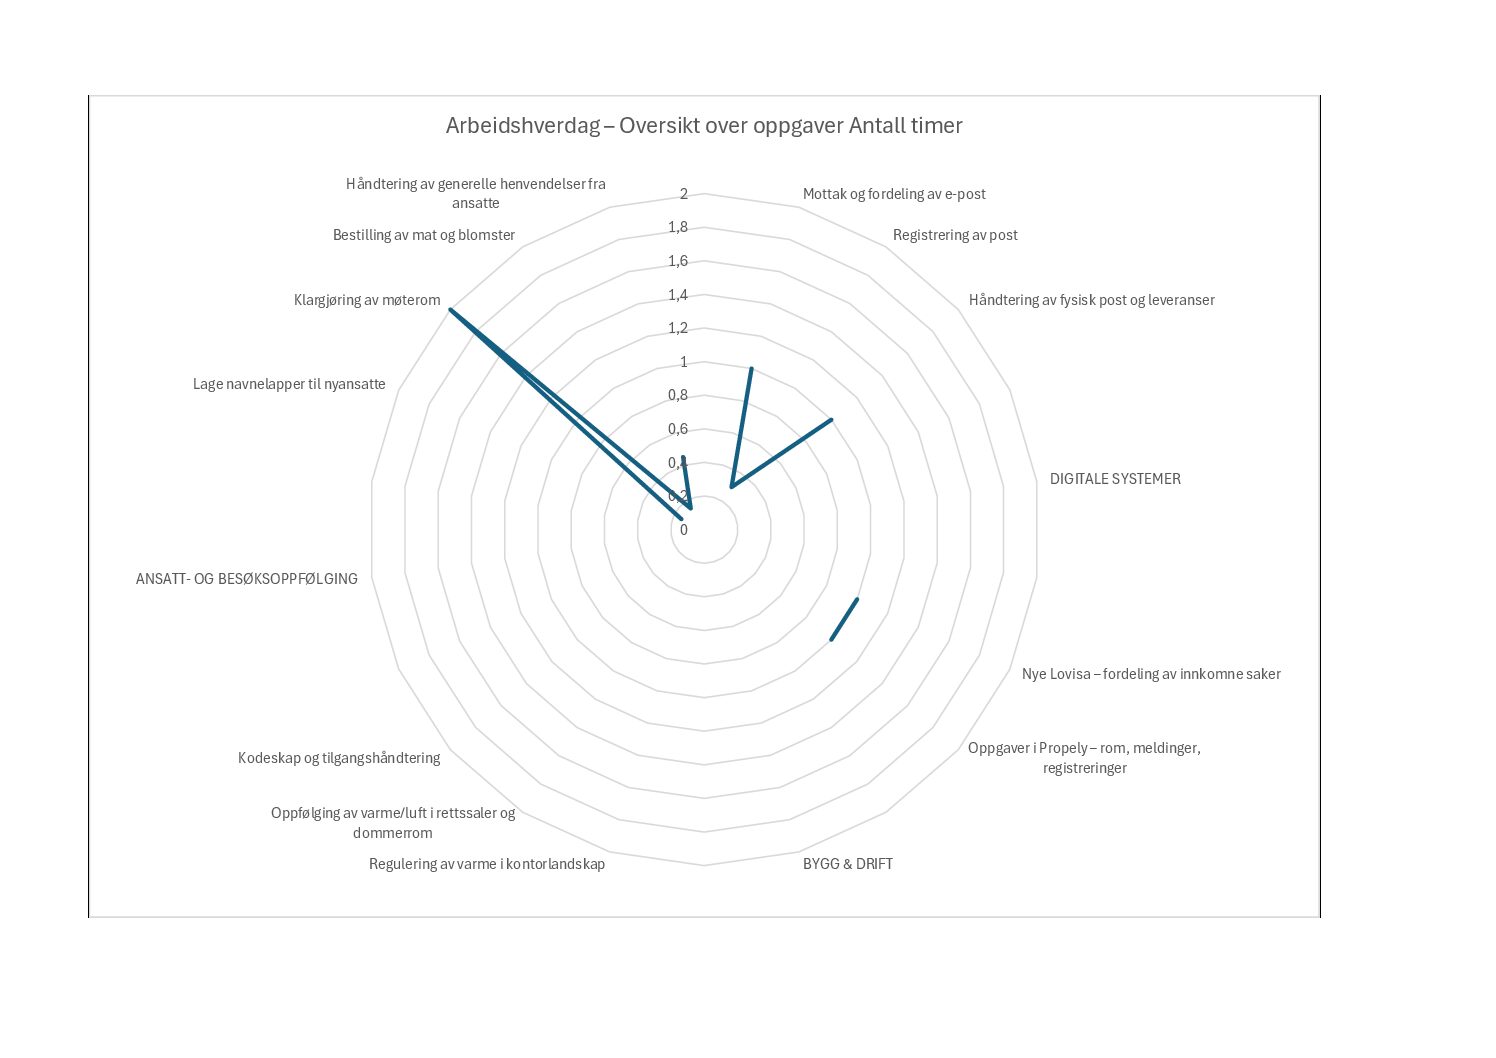
EPOST & POST Antall timer Mottak og fordeling av e‑post 1 Registrering av post 0,3 Håndtering av fysisk post og leveranser 1 DIGITALE SYSTEMER Nye Lovisa – fordeling…
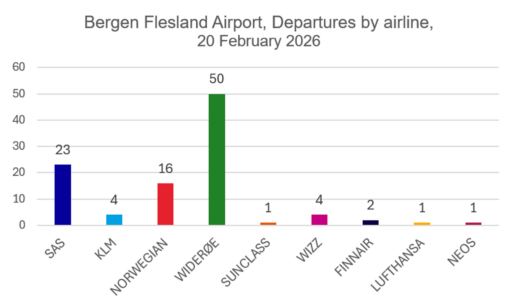
This is a visual representation of the 102 flight departures, sorted by airline, on Friday 20 February 2026 at Bergen Flesland Airport (BGO). Public domain, Avinor.
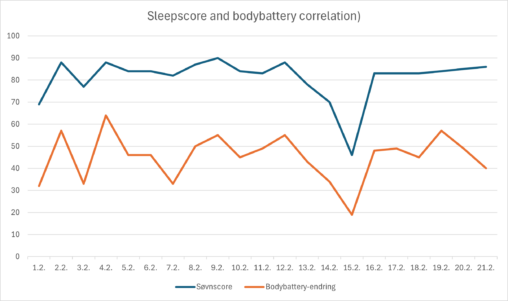
The correlation between sleepscore and bodybatteri in Febrary 2026
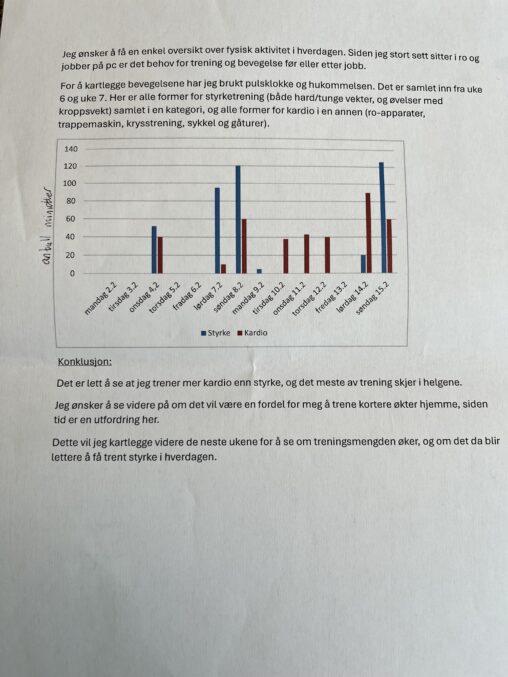
Registrert antall minutter trening av styrke og kardio pr. dag i uke 6 + 7. Brukt hukommelse (de dagene jeg har gått hjem fra jobb siden det er…
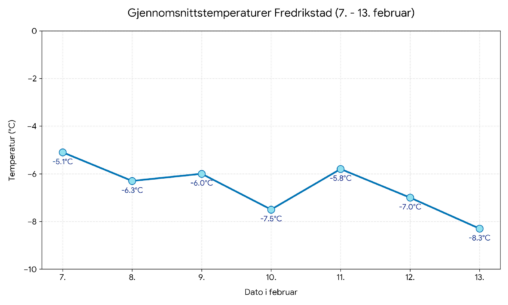
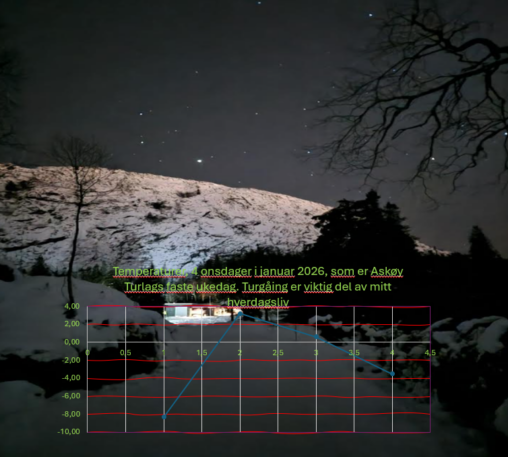
Gjennomsnittstemperatur gjennom uke 7 i Fredrikstad generert av KI med data fra vg.no
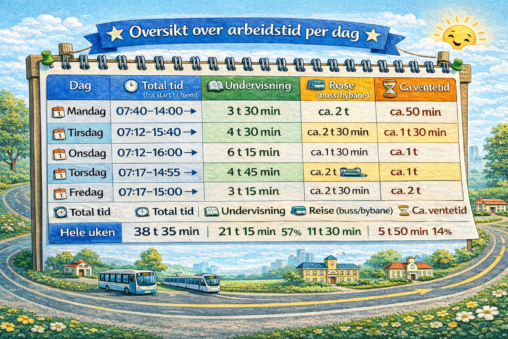
Jeg har en travelt arbeidsuke som består av undervisning, reise med buss og vente på buss. Jeg har prøvd å samle oversikt og se hvor mye tid jeg…
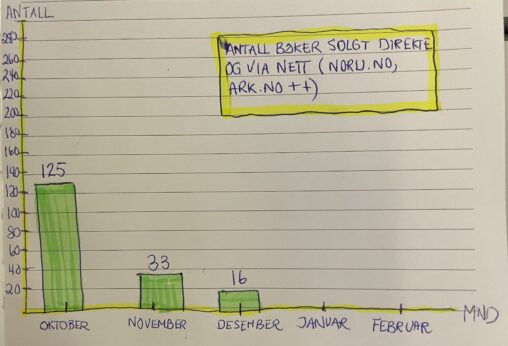
This visualization shows the number of copies of the poetry collection sold per month in Q4 2025. The data represents total units sold (number of books) through direct…
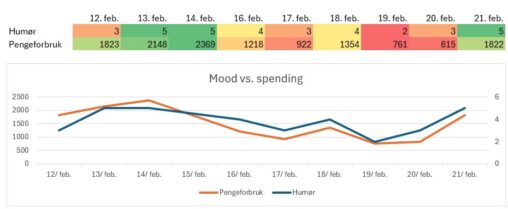
Grafen viser humør angitt i terningkast 1-6 og pengeforbruk angitt i kroner over 10 dager. Resultat: Dataene viser at det kan være en sammenheng mellom humør og pengebruk….
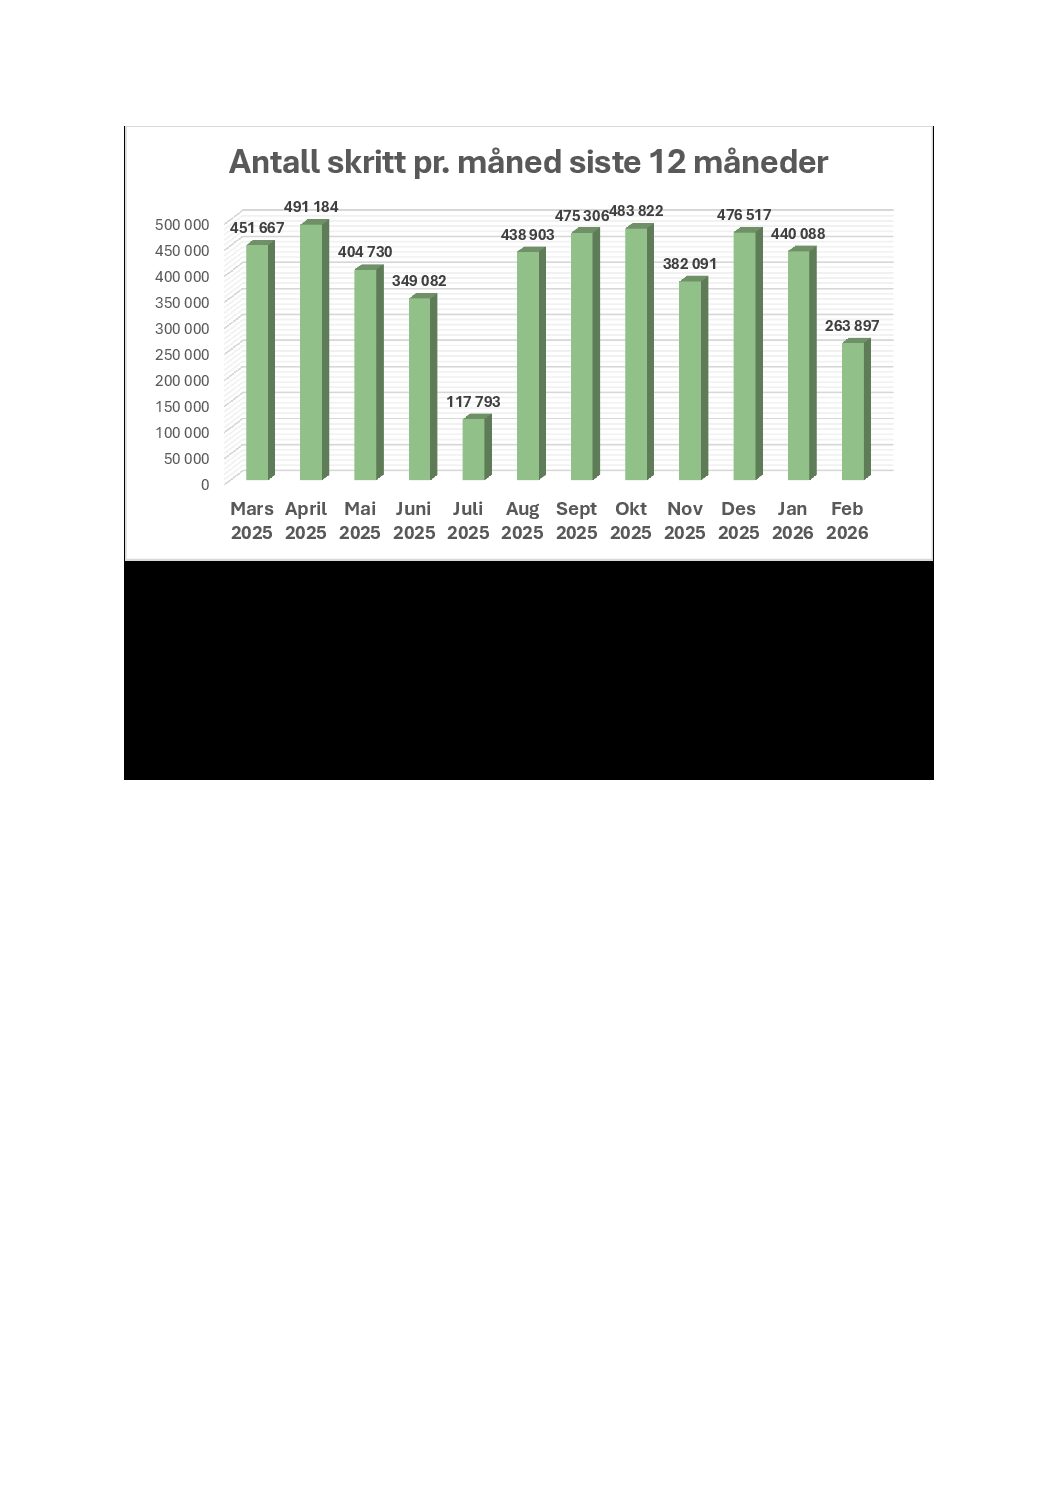
Stolpediagrammet viser en oversikt over antall skritt jeg har gått månedlig de siste 12 månedene. Data er hentet fra min pulsklokke Garmin Vivoactive 5. Jeg overførte data fra…
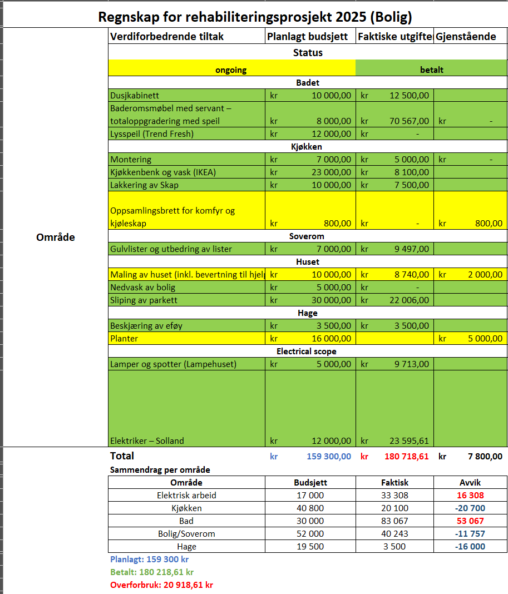
Budget for an apartment upgrading to current standards during 2025 in Norway, all the figures are in Norwegian crowns ( 1$ = 10 NOK)
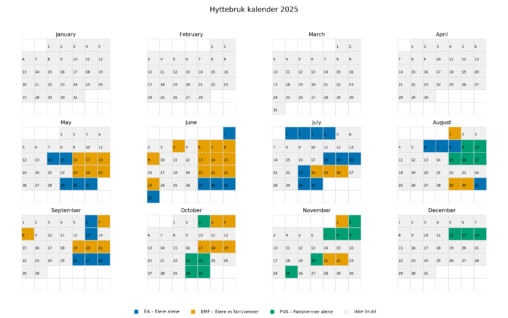
I wanted to find out how much the cabin we bought mid may 2025 was being used all 2025 to check if we got money for value of…
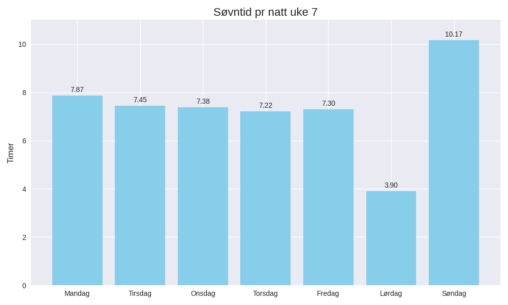
Oversikt over søvnen i uke 7. Data er hentet ut fra Garmin klokke, og deretter laget et diagram med hjelp fra Copilot.
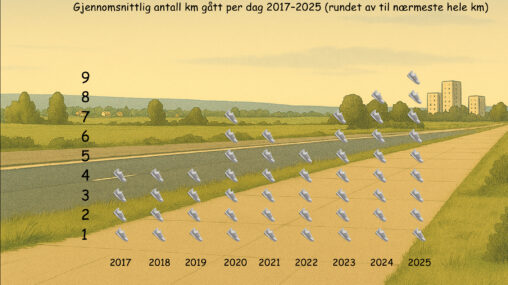
This data visualisation illustrates my average number of kilometres walked per day as registered by the health app on my Apple iPhone from 2017 to 2025. The actual…