
1048 Data visualizations Categorized "my city in data" (page 36 of 53)

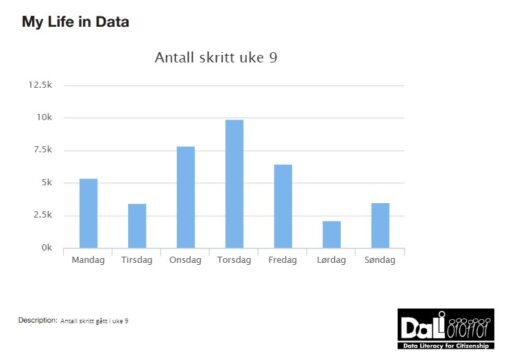
Gjennomsnittlig skritt per dag i februar 2024. Hentet fra appen “Apple Helse” – helse og trening. Grafen viser hvilke 2 dager det var fint vær.
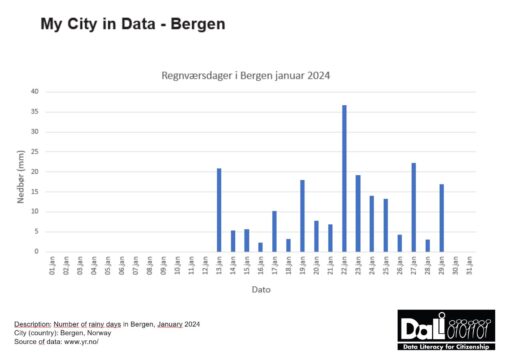
Nedbør (mm) pr dag i Bergen januar 2024. Opphavsrett © NRK og Meteorologisk institutt 2007–2024.

Soltimer i Bergen de siste 5 årene fordelt per måned. Dataene er hentet fra Norsk klima service senter.

Diagrammet viser hvor stor andel i % av den totale skjermtiden min i uke 9 jeg brukte på appene med over 30 min skjermtid. Dataen er hentet fra…
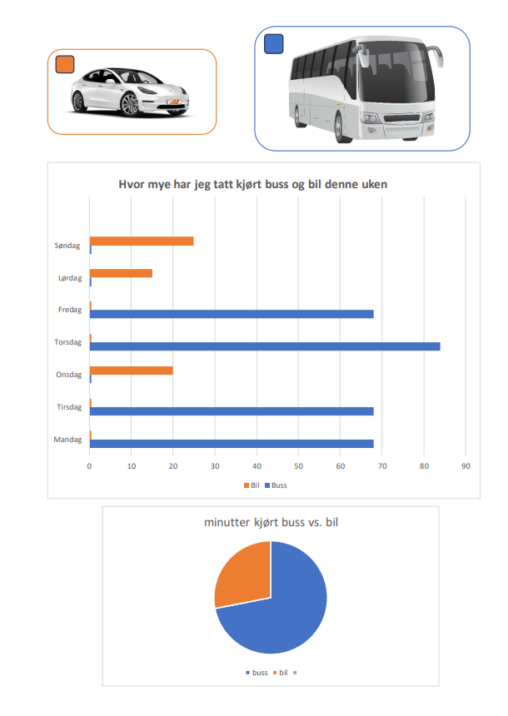
Hvor mye jeg har kjørt buss og bil i løpet av en uke. Dataen er samlet fra 26.02.24 – 02.03.24


Forskjellen på mm nedbør siste 30 døgn målt mellom Førde og Kongsvinger.
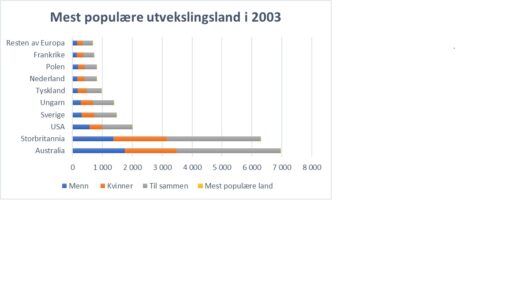
A table over the 10 most popular countries for norwegian exchange students in 2003

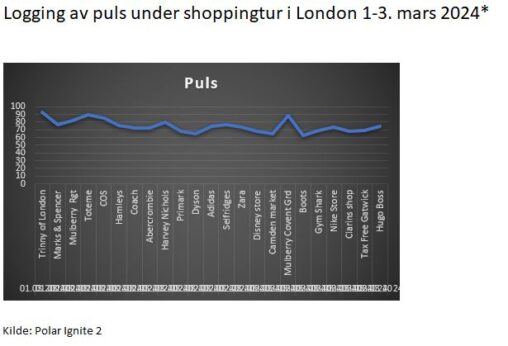
Heart rate measurement while shopping in departement stores/shops/markets in London 1st-3rd of March 2024. Measuring was made while entering the spesific shop and registered analogously. Database is slightly…
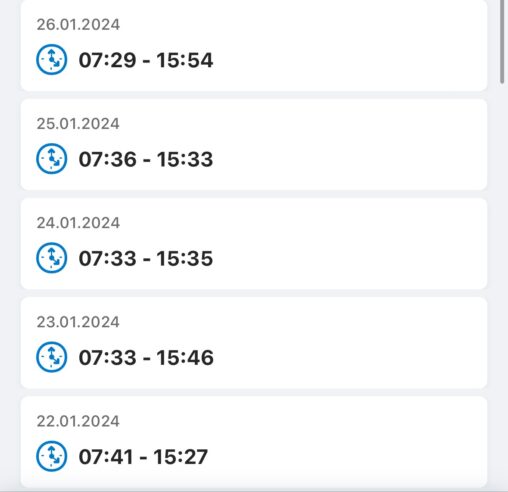
The picture illustrate data of delivery times of a child at nursery and the pickup times.
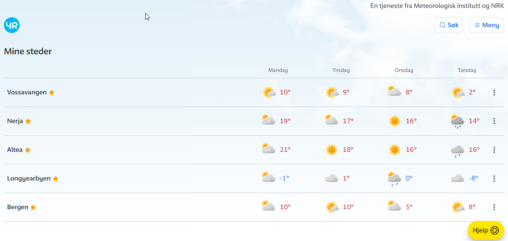
En oversikt over steder jeg har bodd og ukens værvarsel for disse. Hentet fra www.yr.no Opphavsrett © NRK og Meteorologisk institutt 2007–2024

Chart showing average annual precipitation in mm for my hometown (Bergen, Norway) and that of my closest project colleagues around Europe. Climate data from the public domain.


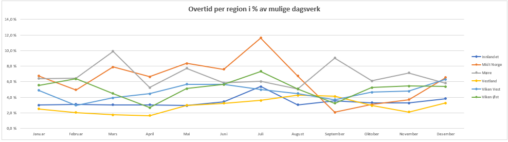
Overtid er en betydelig utfordring i helsesektoren grunnet utfordrende bemanningssituasjon. Vi overvåker derfor dette nøye, både av hensyn til arbeidsbelastning og økonomi. Data er hentet fra bemanningssystemet GAT…