
1048 Data visualizations Categorized "my city in data" (page 35 of 53)

Befolkning i Bergen etter kjønn og alder

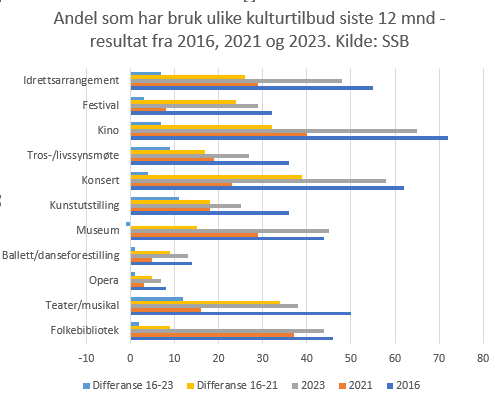
Statistics Norway has collected figures on how many people have used different cultural institutions in the last 12 months, and the figures are from 2016, 2021 and 2023….
I strive to represent the realities of both Bergen, Norway, and Havana, Cuba. I aim to visualize the differences in realities, especially in how the city municipalities of…
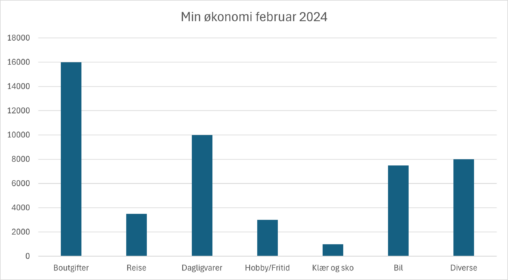
Har hentet ut data fra min nettbank, og satt inn i et stolpediagram i Excel. Alle beløpene er rundet av til nærmeste hele 500 kr.
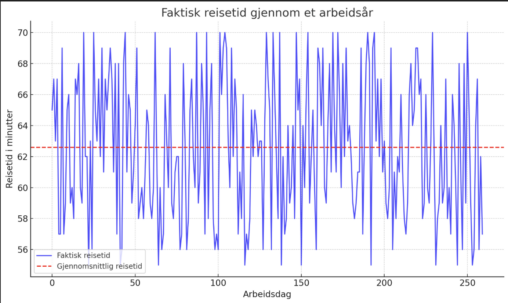
Reisetiden gjennom et arbeidsår, med totalt 260 arbeidsdager. Hver blå linje representerer reisetiden for en enkelt dag, inkludert tiden det tar å levere på skolen og eventuelle forsinkelser….

Dette er en fruktbarhetsapp som i tillegg til å antyde hvilket kjønn barnet du blanlegger vil få – holder styr på når menstrasjon kommer. Den er enkel å…
Based on listening statistics from my personal podcast addict app. The link to the source data cannot be shared in this format. I have used MS copilot to…
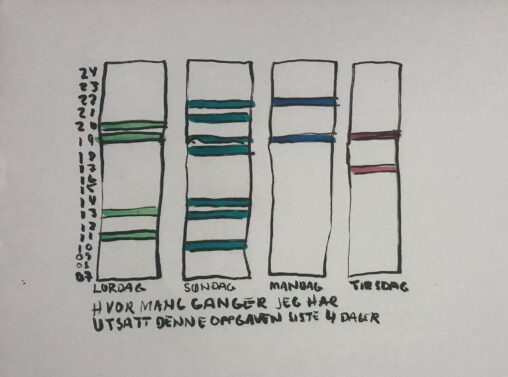
Tabell over siste 4 dagers prokrastinering av eksamensoppgave. Privat tegning.
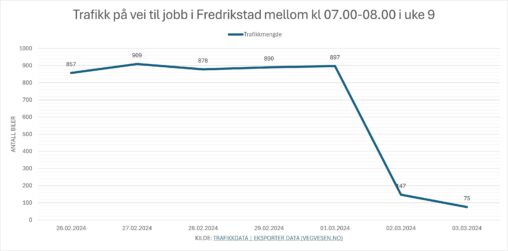
Bilde viser en graf over antall biler mellom klokken 07.00-08.00 på vei til jobben i uke 9. Dataene brukt er hentet fra Vegvesenet sin tellestasjon ST HANSFJELLET og…
Grafen viser sammenheng mellom hvor mange minutter utført trening med minutter dyp søvn pr uke. Tallene er hentet fra min Garmin terningsklokke, og jeg har hentet ut data…
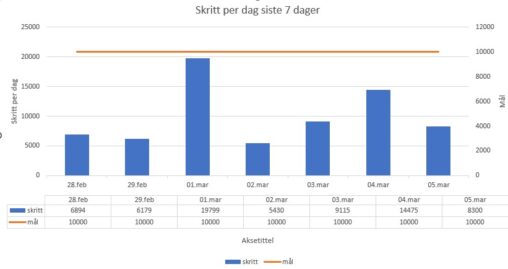
Skritt per dag siste 7 dager. Data hentet fra treningsapp. Illustrasjon laget i Exel.

I collected weatherdata from my smart weatherstation for the last three months. The data is exessive but shows temp, humidity, co2 and noise pressure. When i set it…

Med utgangspunkt i 5 forskjellige aktiviteter viser grafen deltakelse av seniorer i et tidsrom på rundt et halvt år. Dataene er basert på frammøteregistrering i et aktivitetslokale, dataene…
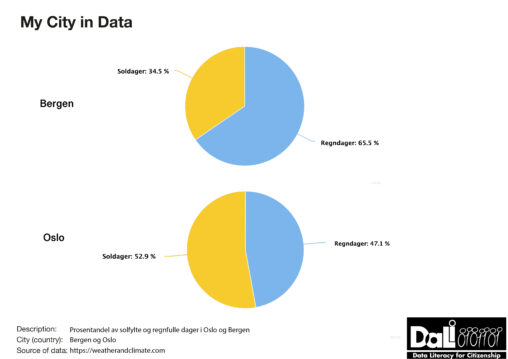
Diagrammene representerer åpne data fra weatherandclimate.com som er visualisert med Miro graphs extension.


These are virtual achievements earned in the online game World of Warcraft, that I have been playing for some years. This snapshot is from one of my characters…