1048 Data visualizations Categorized "my city in data" (page 33 of 53)
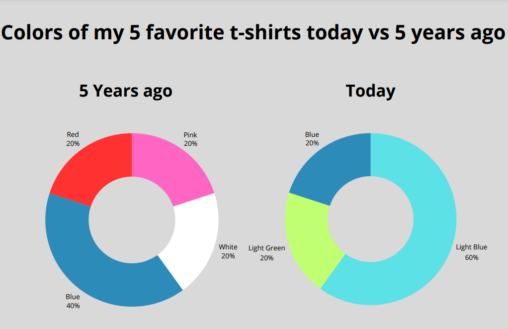
The colors you wear can say something about who you are. Here are the colors of my 5 favorite t-shirts today and 5 years ago.

Denne dataen visualiserer hvor mange timer jeg brukte på mobiltelefonen min i uke 36. Nærmere så visualiserer daten hvilke apper som ble mest brukt denne uken. Dette var…

Week 35 og uke 36 2024 august and september. My data and numbers of my study time pr Day

Does good sleep buffer against stress? I looked at one week in June 2024 in the Apple Health and Stress Monitor apps on iPhone and was surprised at…
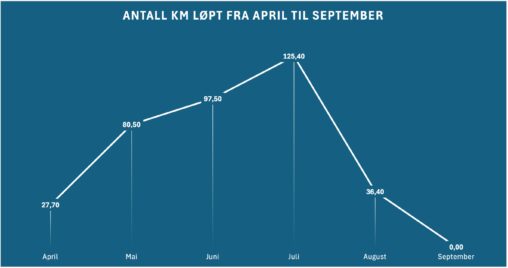
The photo visualizes personal running stats from April to September. The data is collected from my Strava account.

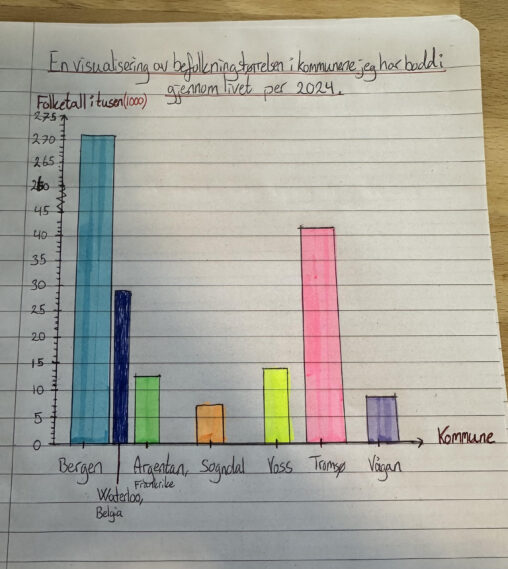
Dataen viser antall folketall/innbyggertall i de ulike kommunene.

Hentet her ut data om antall skritt jeg hadde i uke 34 igjennom Helse-appen på min iPhone. Jeg tok inn dataene i excel og laget ett histogram for…

Tabellen viser antall hjort som har blitt felt under hjortejakten i Ørsta de siste årene. Offentlig domene Møre-nytt
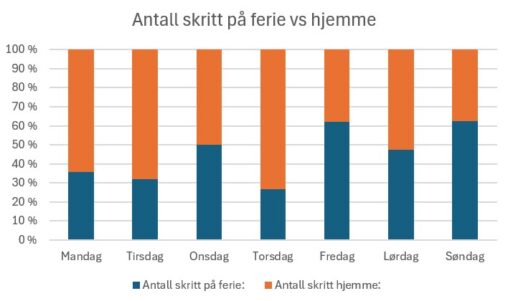
I denne dataen sammenligner jeg antall skritt daglig på ferie med når jeg er hjemme. Diagrammet viser en prosentvis fordeling mellom skrittene. Ferieperioden er 19.08 – 25.08, mens…

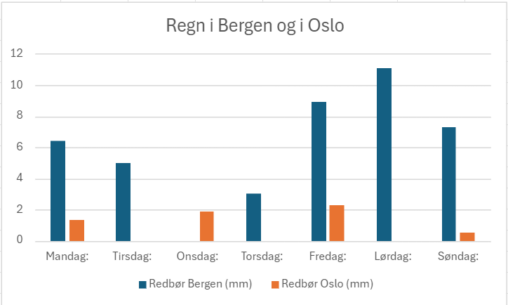
The data is from Bergen kommune (https://www.bergen.kommune.no/omkommunen/fakta-om-bergen/klima/tall-som-beskriver-klima-i-bergen). They have recieved the data from Meteorologisk institutt, Florida målestasjon. The figure shows the difference between rainy days in Bergen in…
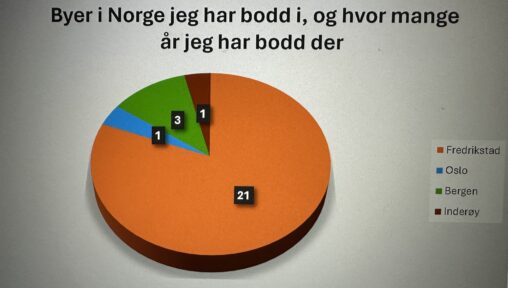
Dette diagrammet viser ulike byer i Norge jeg har bodd i i løpet av mitt 26 år lange liv, og hvor mange år jeg har bodd i hver…
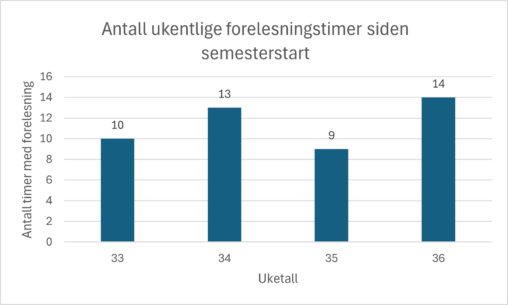
X-aksen representerer ukenummer fra dette semesteret startet, mens y-aksen representerer antall uker med forelesning jeg hadde i hver av disse ukene.


Bruk av Skjermtid (tal minuttar) på min telefon 26. februar fordelt på kategoriane «kreativitet», «sosialt» og «produktivitet og finans» til ulike tider på døgnet.