
1050 Data visualizations Categorized "my city in data" (page 30 of 53)
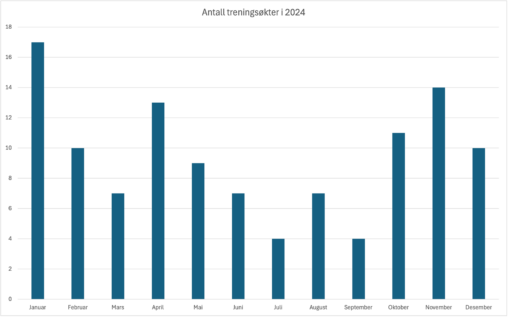
Dette er en visualisering av antall treningsøkter jeg hadde i 2024. Ved å ta en titt på stolpediagrammet, kan man tydelig se at den mest travle treningsmåneden var…
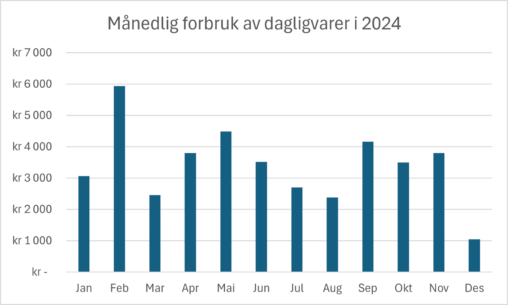
Stolpediagram over mitt månedlige forbruk av dagligvarer i kroner for 2024. Personlig data.
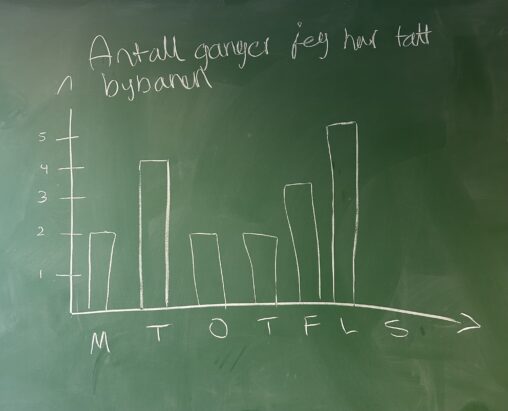
Stolpediagram som tar for seg antall ganger jeg har vært på trening i perioden de tre første ukene i januar 2025. Aksene tar for seg antall ganger vært…

Antall besøk jeg har hatt hos de forskjellige Sammen treningssenterene i Bergen fra 01.09.21 til 21.01.25
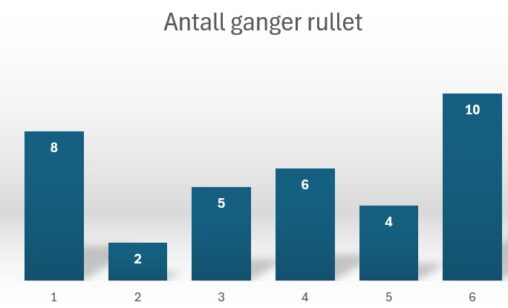
Diagrammet viser resultater av 35 kast med en terning, der hver stolpe representerer hvor mange ganger et bestemt tall (1 til 6) dukket opp.
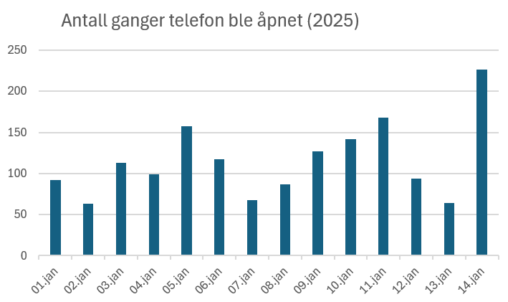
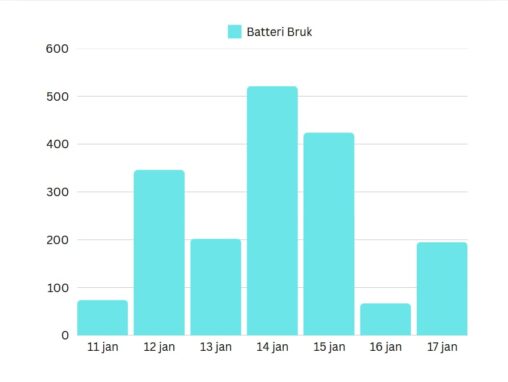
Dette er en visuell representasjon av hvor mange ganger min telefon ble åpnet hvert døgn. Dataene er hentet mellom 1. Januar 2025 og 14. Januar 2025.
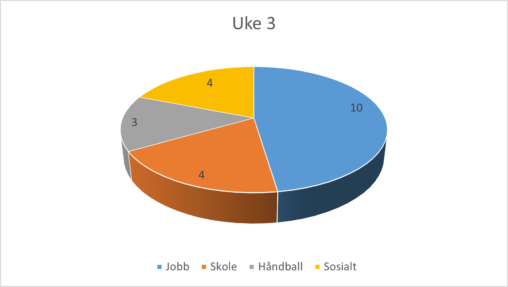
Figuren representerer tidsbruken min (antall timer) i uke 3 fordelt på aktiviteter jeg holder/holdt på med.

Bildet viser ukentlig skritttelling for den første uken i 2025, der Y-aksen representerer antall skritt og X-aksen viser de syv dagene i uken. Dataene visualiserer daglige skritt, og…
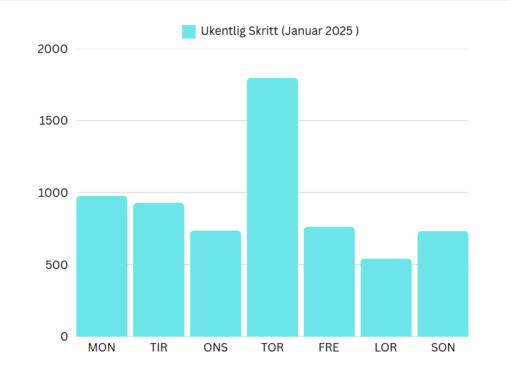
Bildet viser ukentlig skritttelling for den første uken i 2025, der Y-aksen representerer antall skritt og X-aksen viser de syv dagene i uken. Dataene visualiserer daglige skritt, og…
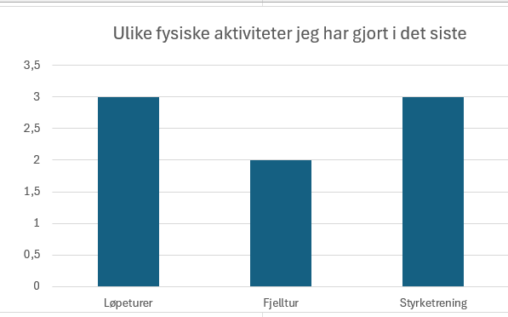
Det som er fremstilt er ulike typer fysisk aktiviteter jeg har utført i det siste. Jeg har gått 2 fjellturer, 3 løpeturer og 3 typer styrkeøkter
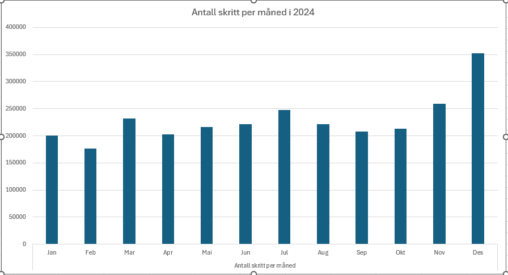
Grafen viser antall skritt jeg har gjennomført i 2024. Antallet er kalkulert ut fra min helse app på telefonen som oppgir gjennomsnittlig skritt per dag per måned. Videre…
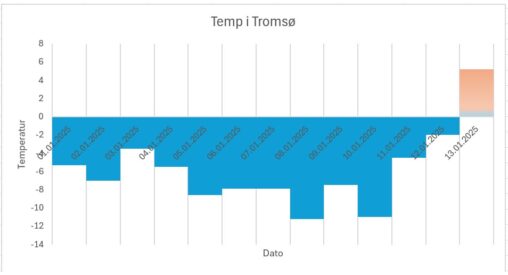
Snitt temperatur i Tromsø i løpet av Januar 2025 i (representert i grader Celsius). Data brukt i illustrasjon kommer fra sida yr.no. Temperatur økt med nesten 15 grader…
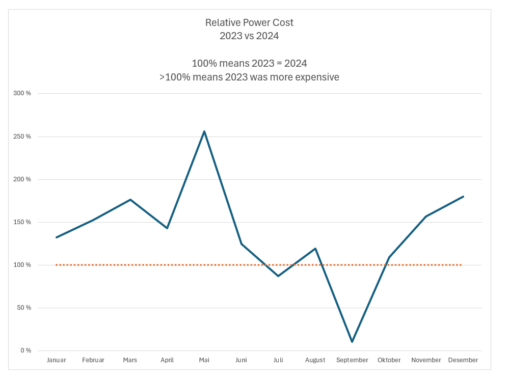
The figure shows the relative cost of power in my house. 2023 prices were historically high, and thus far there are only 2 months that were more expensive…

Dette er oversikt over min uke. hvor mange del av uken tar enkelte oppgavene. Det kan variere litt men dette er gjennomsnitt.
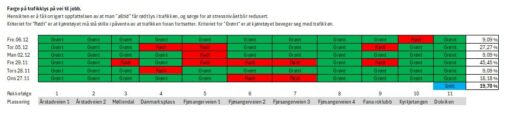
Farge på trafikklys på vei til jobb. Hensikten er å få korrigert oppfattelsen av at man “alltid” får rødt lys i trafikken, og sørge for at stressnivået blir…
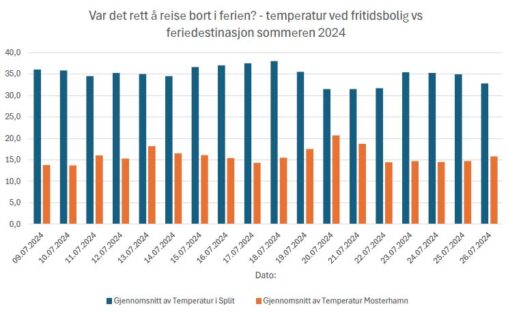
When you live on the west coast of Norway, you get used to the fact that the summers are often cool. Then it becomes almost kind of a…