
1051 Data visualizations Categorized "my city in data" (page 3 of 53)

Menstruation cycle of a woman (born year 1998) from March 2024-February 2026. The data represents how many days spent menstruating each day of a given month. The data…
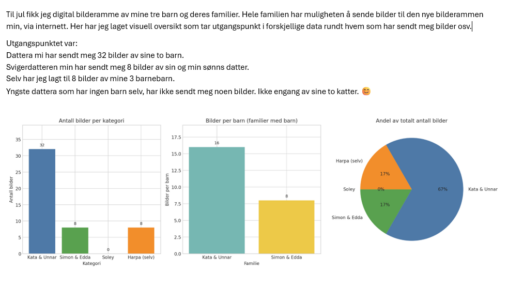
Digital bilderamme – Hvem har sendt bilder av sine barn eller barnebarn
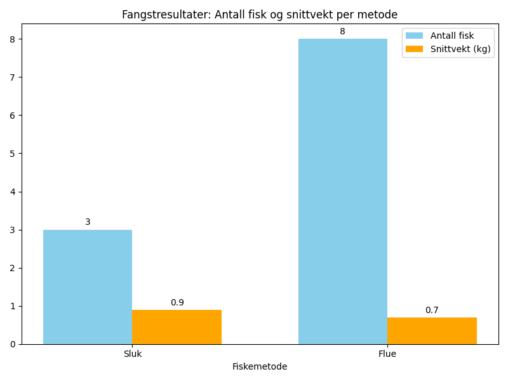
These are my recent results of my sea trout fishing in a Norwegian fjord
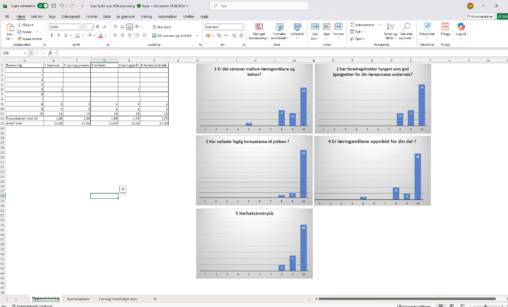
Data were collected from evaluation forms from 22 course participants after a 2‑day course in Berlin.
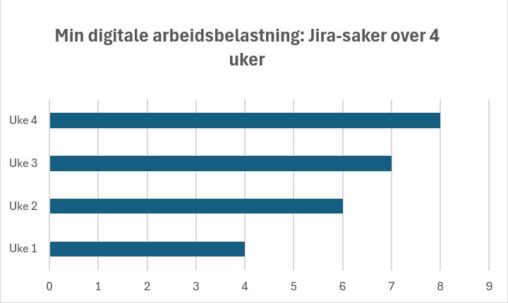
Jeg valgte å visualisere antall Jira-saker per uke fordi dette representerer min digitale arbeidsbelastning. Økningen fra uke 1 til uke 3 viser en tydelig intensivering av arbeidsmengde, før…
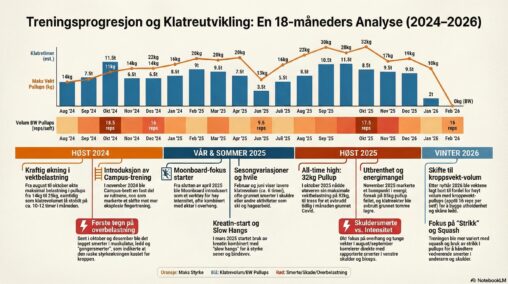
Visualization using graphs and text showing my development of strength in climbing-related exercises over time from fall 2024 to winter 2026. Includes periods with specialization, using tools such…
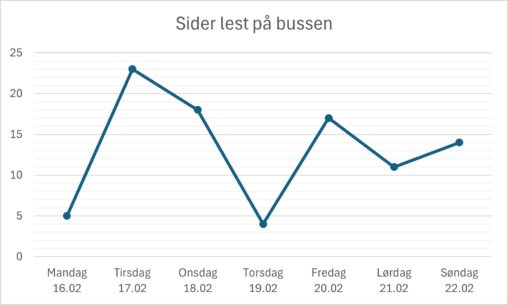
Jeg samlet data på hvor mange sider jeg leste av “Wuthering Heights” av Emily Brönte på bussen i løpet av en uke. Noen dager var det mer kø…
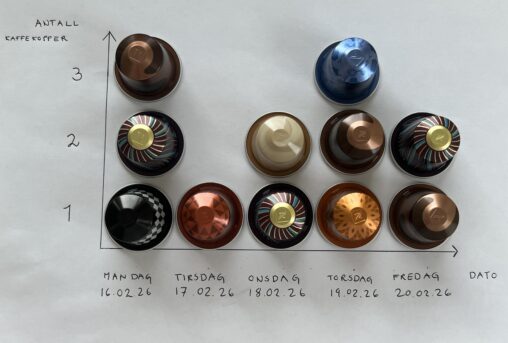
Visualiseringen viser antall kaffekopper konsumert i løpet av en arbeidsuke. Data ble samlet inn fra og med mandag 16.02.26 til og med fredag 20.02.26. Hver Nespressokapsel illustrerer én…
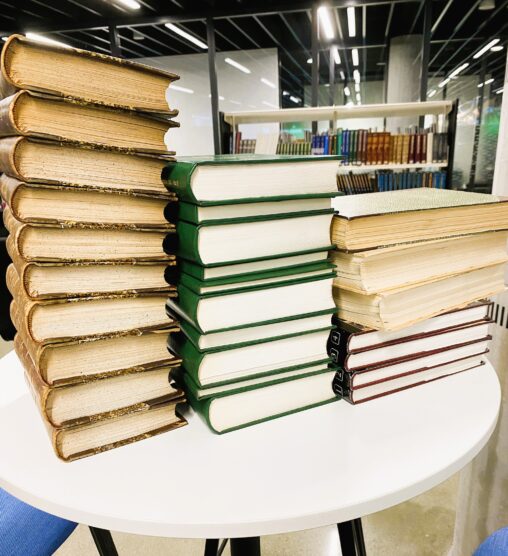
Jeg leste ti bøker i november, ti i desember og syv i januar
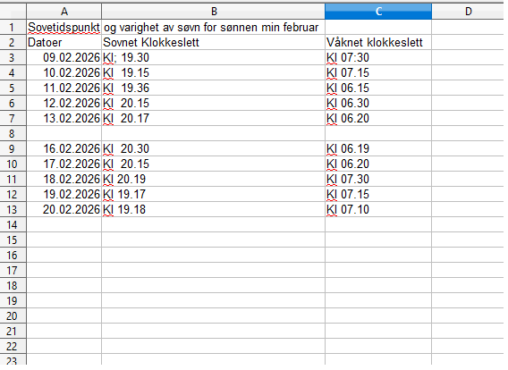
Her ser dere tidspunkter for når min sønn på 4 år sovnet noen dager i februar og når han sto opp. Ville se om han sto litt senere…
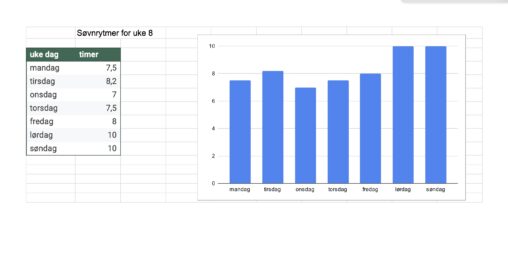
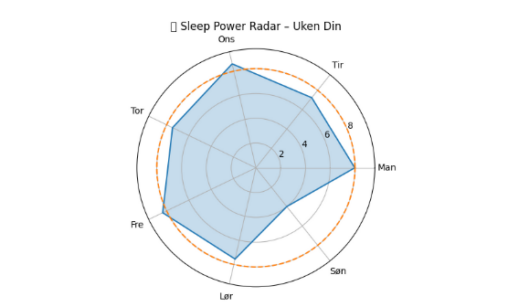
The data are my sleeping hours for week 8. I have gathered the data from my watch.
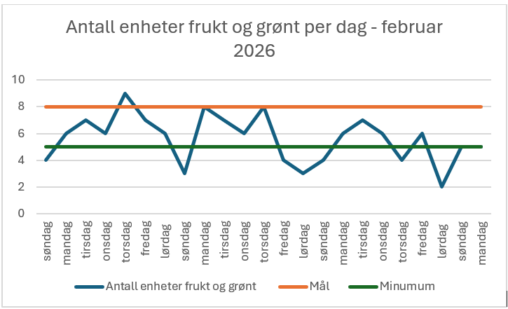
Grafen viser antall enheter frukt og grønt konsumert per dag i februar 2026. Målet er 8 enheter, minimum 5 enheter.
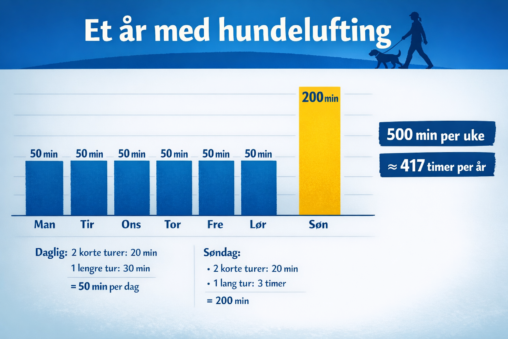
My one year walking the dog, hours anually spent. Put all my data into ChatGPT, promted it to make an visualization
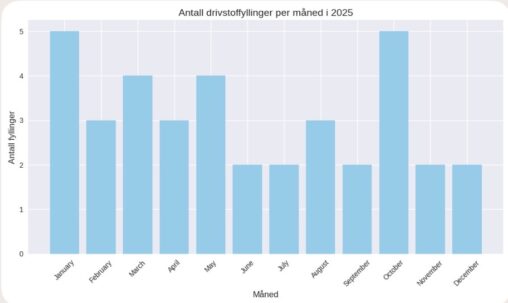
Antall Bensinfyllingar per månad i 2025. Fann data i nettbanken som viser datoane eg har fylt bensin i 2025. Skreiv datoane inn i Copilot og bestilte ei visuell…
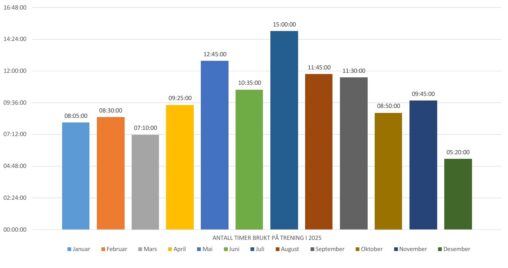
The data presentation provides a complete monthly overview of time spent exercising throughout 2025. It is based on my personal data from a fitness app.
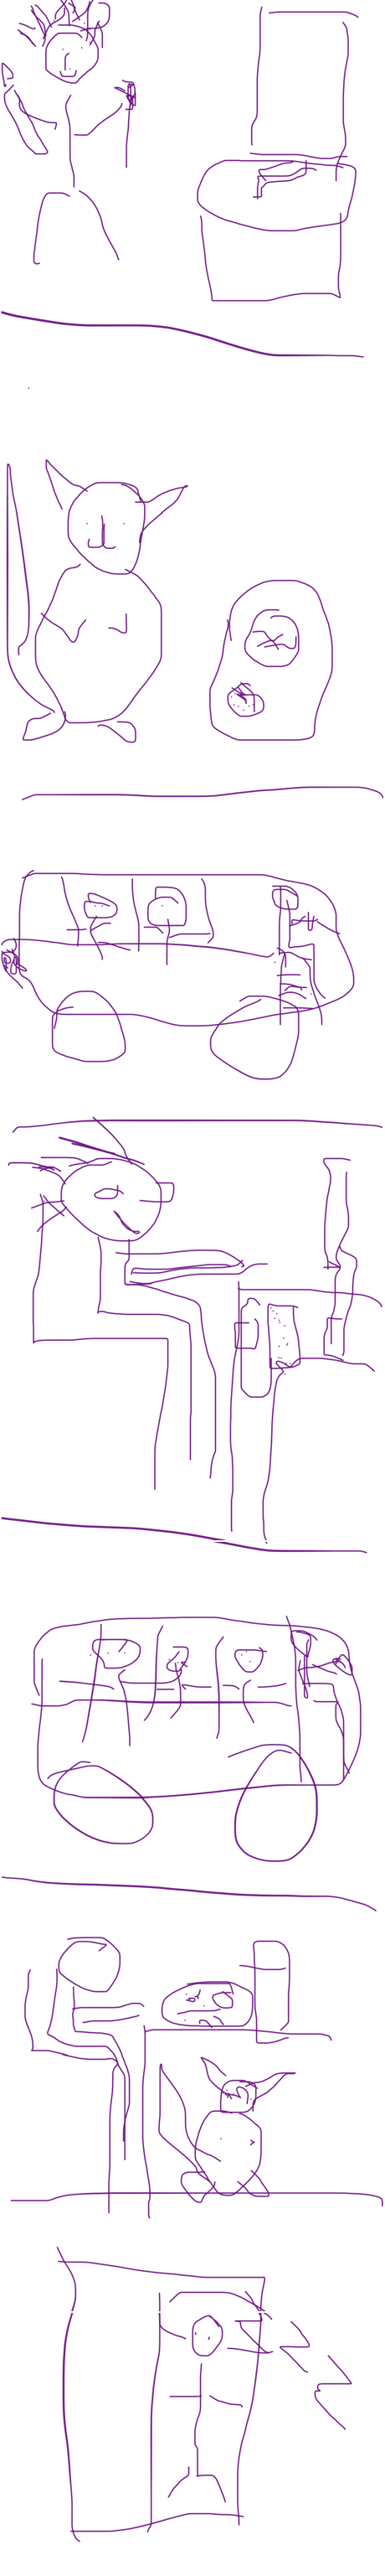
Min hverdag: Jeg står opp kl. 06.00, pusser tennene og mater katten. Deretter tar jeg bussen til arbeid. Arbeider mellom 08.00 og 15.30, deretter tar jeg bussen hjem…
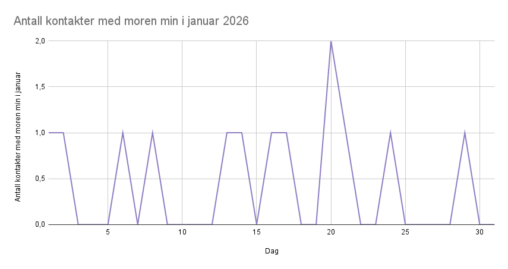
Jeg ville vite hvor ofte jeg ville ringe moren min, som bor i et annet land, i januar 2026.
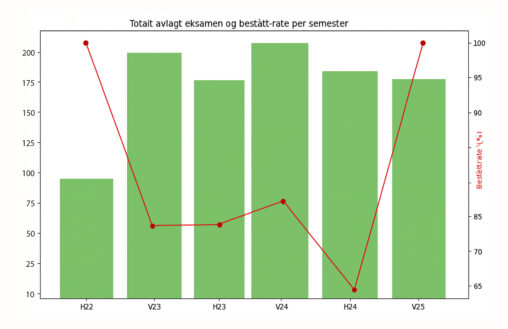
Visualisering av hvor mange som fullførte emnet ‘DIGI110 Fantastiske data’ ved Universitetet i Bergen fra og med høsten 2022 til og med våren 2025, og hvor stor andel…