
1051 Data visualizations Categorized "my city in data" (page 21 of 53)
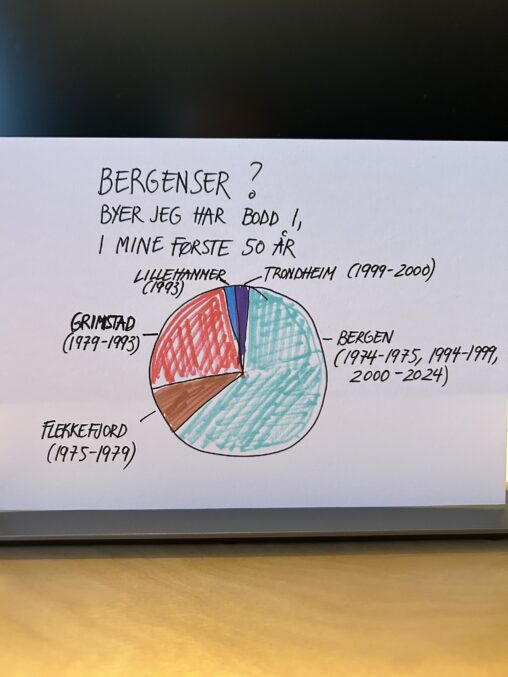
Kakediagrammet viser byer jeg har bodd i. Registreringen er basert på egen hukommelse, med data for hvert år – rundet av til hvert hele kvartal av årene. Jeg…
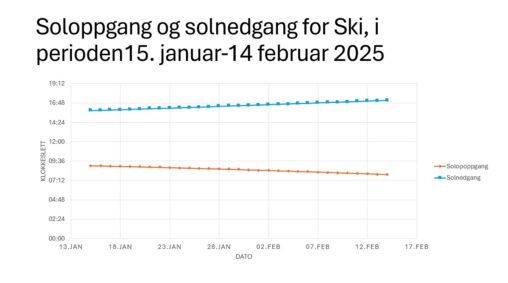
Soloppgang og solnedgang for Ski, i perioden15. januar-14 februar 2025, Dette gir en oversikt over økningen av dagslys,
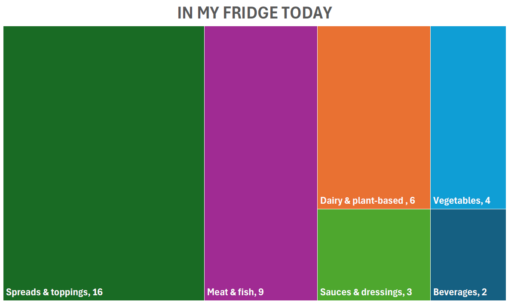
This treemap visualization represents the number of food items in my refrigerator, categorized into beverages, dairy and plant-based products, spreads and toppings, vegetables, meat and fish and sauces…
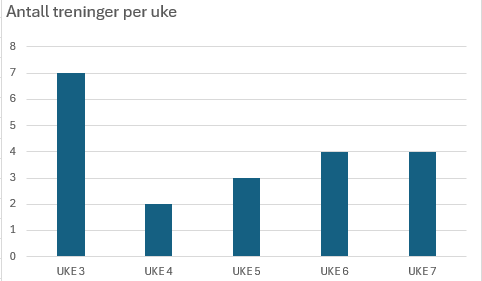
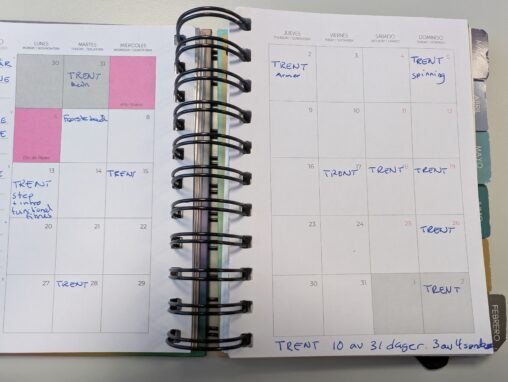
Kolonnediagram viser antall treninger jeg har gjennomført per uke på treningssenter. Data er innhenter fra treningssenterets app. Appen registrerer når du trener og hvilken type trening du gjennomfører….
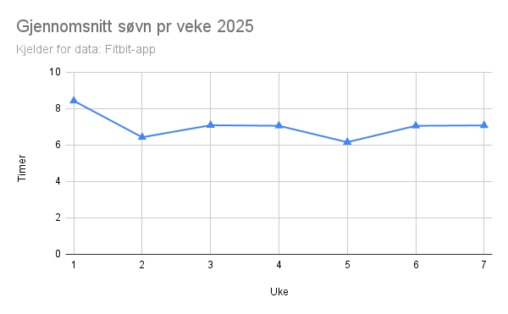
Gjennomsnitt av søvn pr uke, oppgitt i timer og minutter. Fra uke 1 til uke
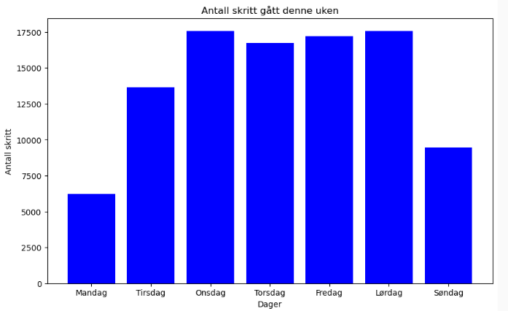
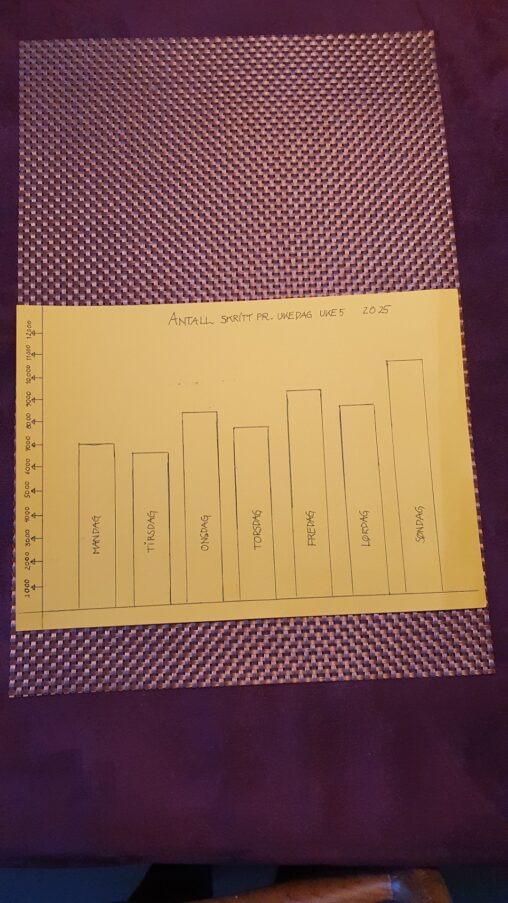
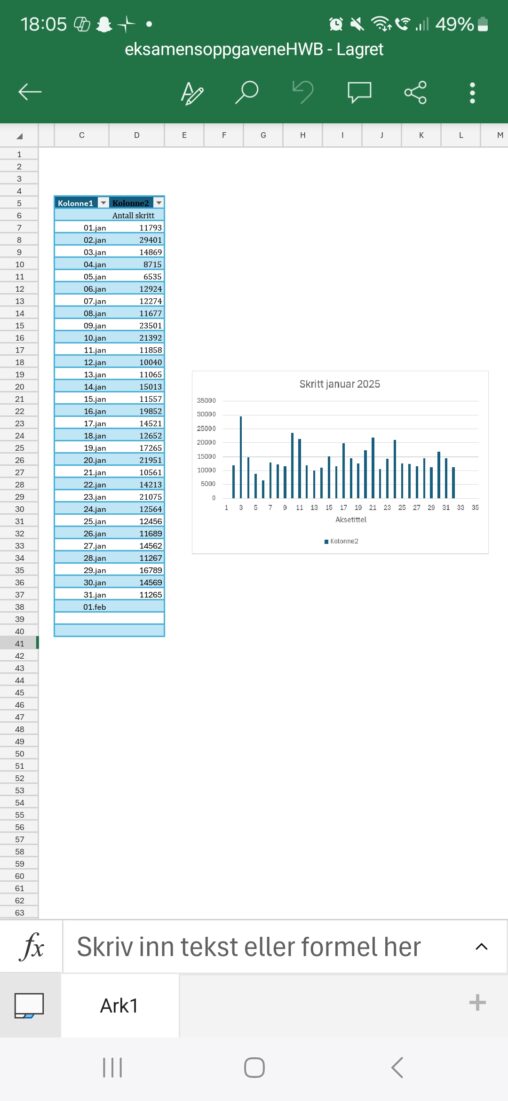
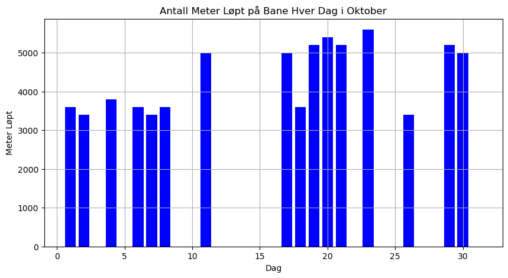
Grafene viser hvor mange skritt jeg har gått de ulike dagene i uke 7, 2025. Denne uken hadde jeg som mål å øke antall skritt fra maks 10…
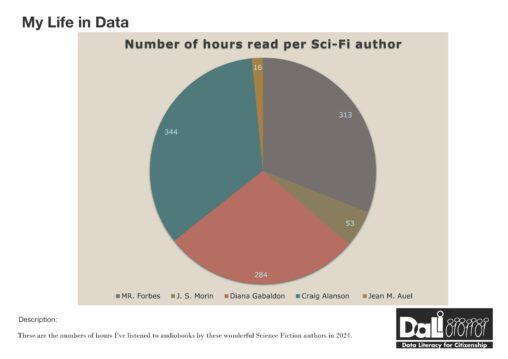
En oversikt over antall timer jeg har lyttet til lydbøker innen Science-fiction i 2024, fordelt på fem forfatterne jeg har lyttet mest på.
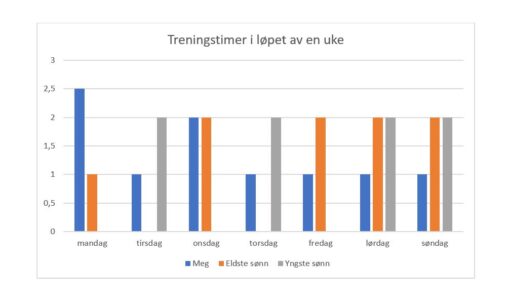
Kolonnediagram som viser antall aktive treningstimer i løpet av uke 6 i 2025, fordelt på meg og de to guttene mine. Aktive treningstimer gjelder aktivitet på fjellet, fotballbanen…
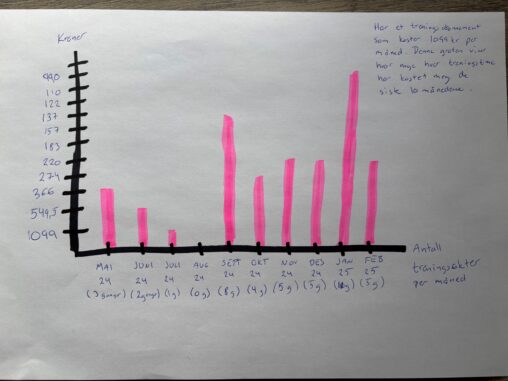
Har et treningsabonnement som koster 1099 kroner per måned. Denne grafen viser hvor mye hver treningstime har kostet meg per måned, de siste 10 månedene.
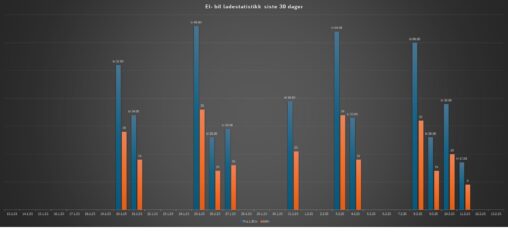
El- bil ladestatistikk siste 30 dager. X- akse er dato og y- akse er kwh og totalpris.

Viser total handling på CoopExtra i Kirkenes for 2023 til familie med 3 medlemmer
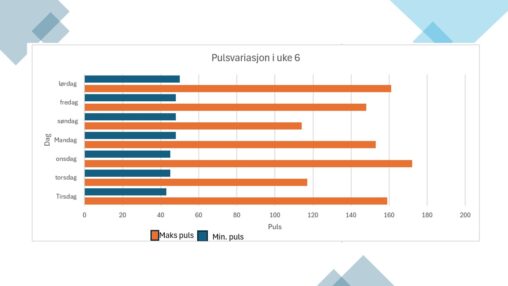
The digram shows my maximum and minimum heart rate every day, throughout a week in 2025.
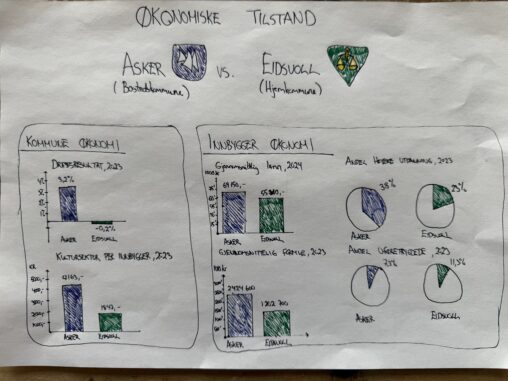
Visualiseringen viser noen nøkkeltall for å vise forskjellen mellom den økonomiske tilstanden mellom Asker kommune og Eidsvoll kommune. Nøkkeltallene som er valgt viser: – Driftsresultat – Kultursektor per…
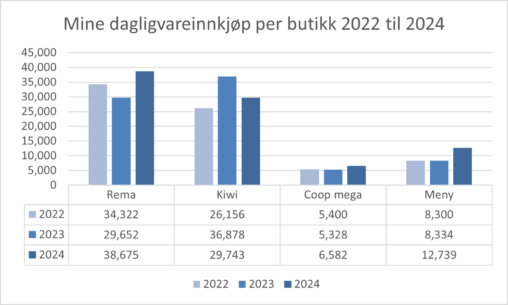
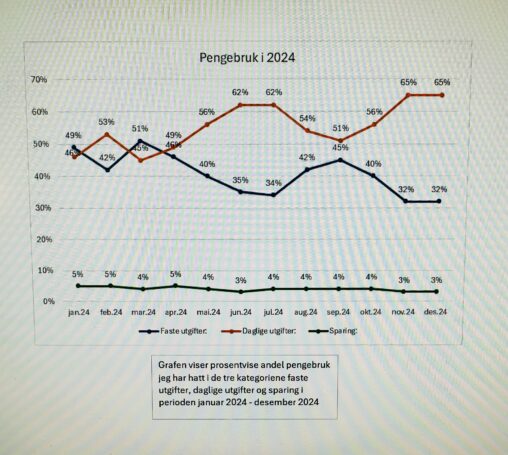
Søylediagram i Excel basert på kontoutskrifter i perioden 2022 til 2024.