1051 Data visualizations Categorized "my city in data" (page 18 of 53)
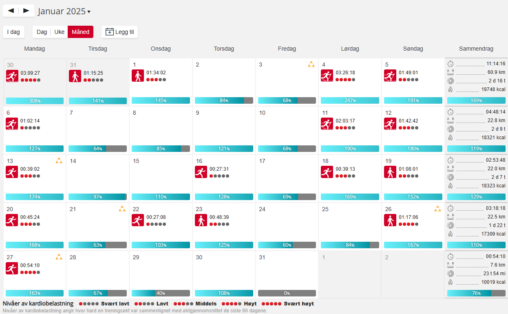
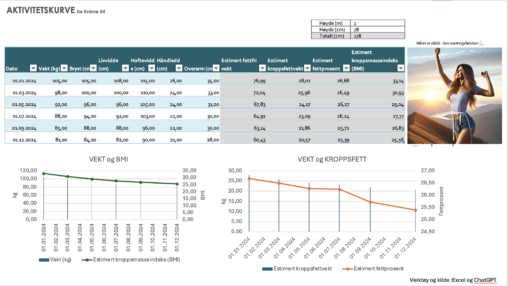
Dataene viser registrerte treningsøkter, treningsform, treningstid og intensitet.
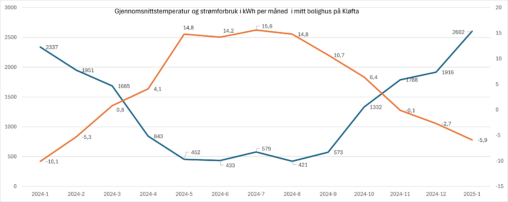
Gjennomsnittstemperatur er representert i Celsius grader pr måned. Strømforbruk representert i kilo Watt timer per måned
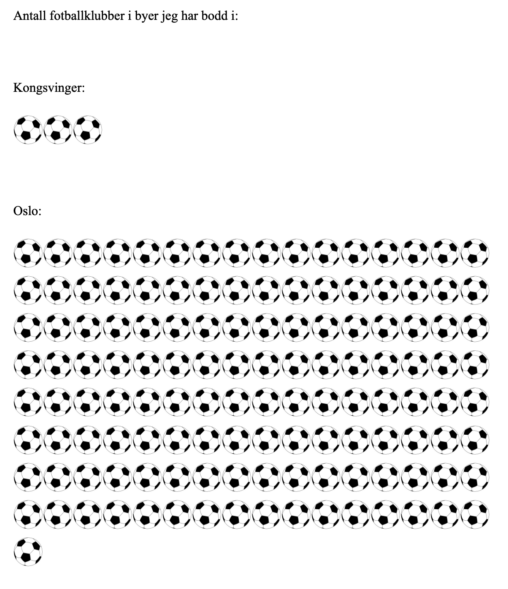
Open Clip Art Library (https://no.wikipedia.org/wiki/Fotball_%28ball%29#/media/Fil:Soccerball.svg)
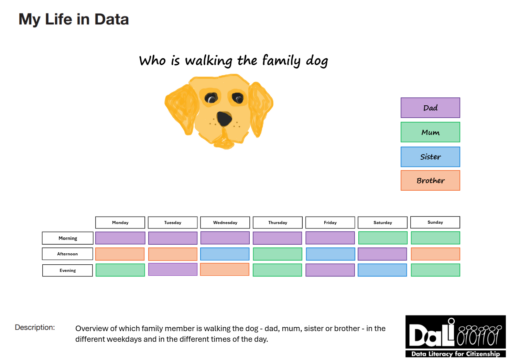
Table overview over who is walking the dog (dad, mum, son or daughter) the different weekdays and different times of the day (morning, afternoon, evening). The table shows…
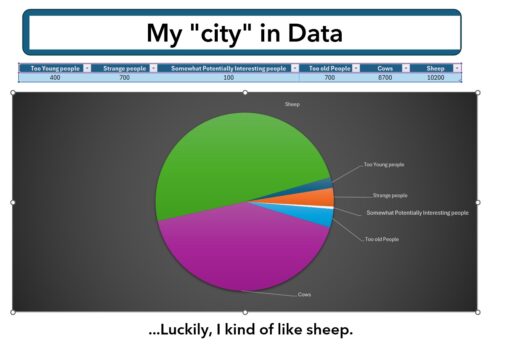
The diagram visualizes the number of inhabitants in my hometown, categorized by myself. In addition to the number of cows and sheep, which form a very important part…
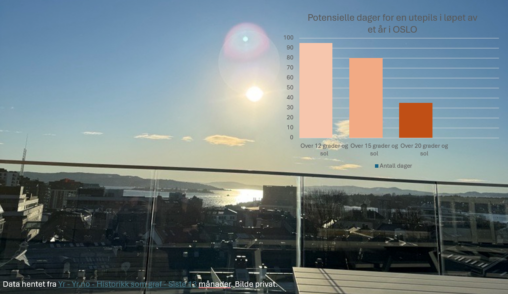
The number of dates it is possible to enjoy a beer in the sun in Oslo. https://www.yr.no/nn/historikk/graf/0-671/Noreg/Oslo/Oslo/Yr.no owns the data. The picture is private.
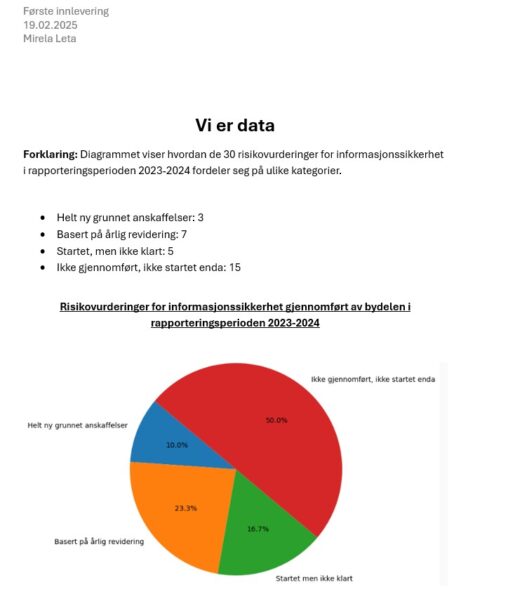
Diagrammet viser hvordan risikovurderingene fordeler seg på ulike kategorier. Helt ny grunnet anskaffelser: 3 risikovurderinger Basert på årlig revidering: 7 risikovurderinger Startet men ikke klart: 5 risikovurderinger Ikke…
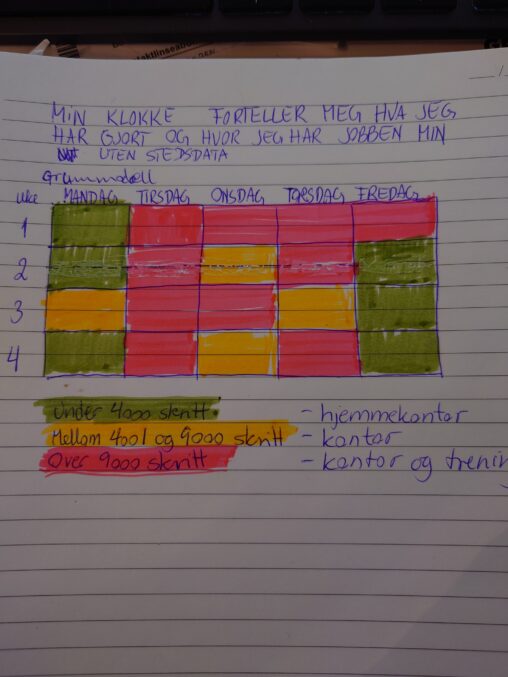
I have registered my number of steps each day. By working on the data for what day it was (monday – friday) and the number of steps I…
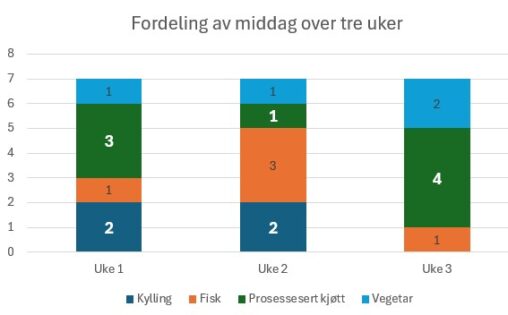
Dette bilde viser fordelingen av type middag over tre uker. Fordeling av fisk, kylling, kjøtt og vegetar. Gi meg innsikt i om jeg får i meg anbefalt mengde…
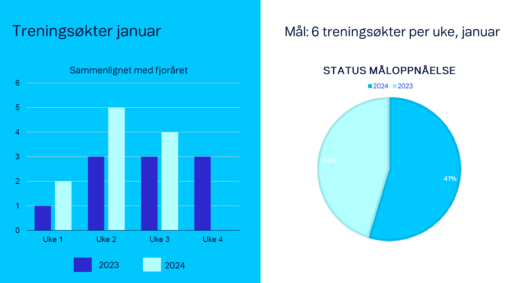
Her har jeg benyttet loggført data av egen trening via SATS appen og apple watch. Resultatet er en oversikt som viser målsetningen på 6 treningsøkter, hvordan jeg ligger…

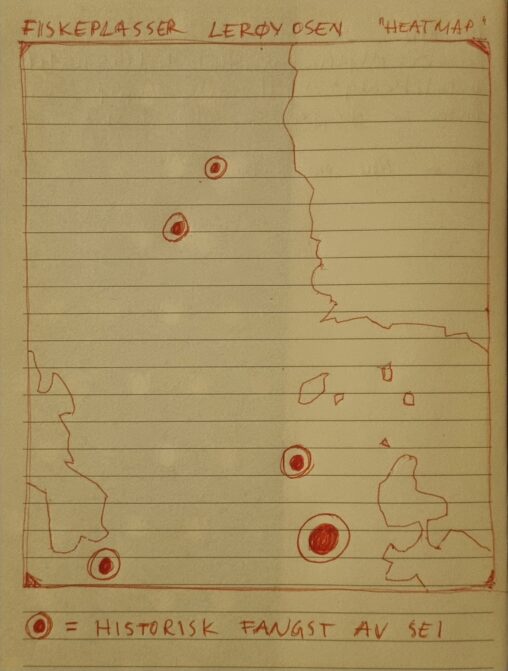
The heatmap is suppsed to visualize relative amount of “fishing luck” (as we say in Norwegian) at different spots in the map square, basert on previous private experiences.
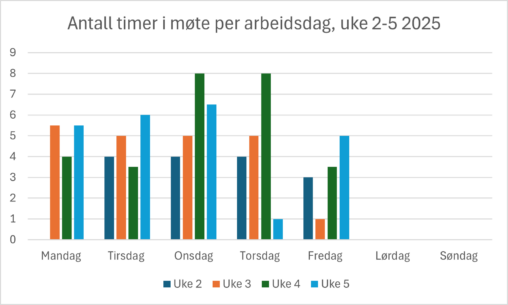
Hours in meetings per workday. Data is from my Outlook calendar and is visualized in Excel.
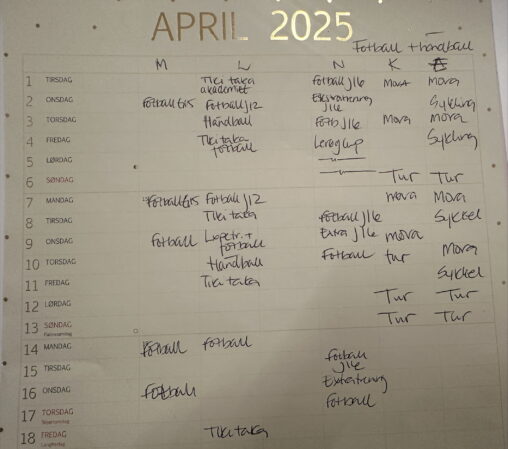
This is a normal week in our family for activities like Football and handball for the 3 kids, and exercising like hiking and gym for the adults.
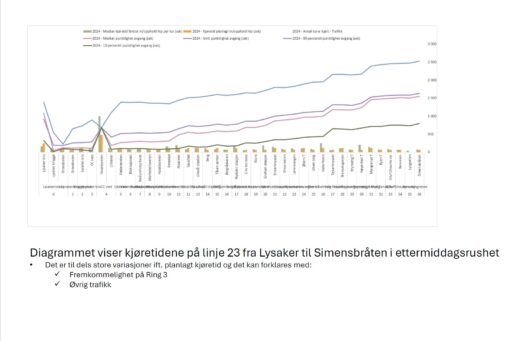
Rapporten viser kjøretid på linje 23 i ettermiddagsrush i retning Simensbråten. Den viser også avvik fra planlagt kjøretid, og evt. behov for omfordeling og/eller revidering av kjøretid.
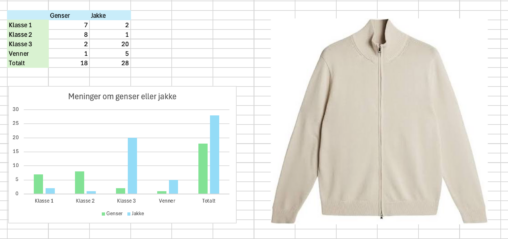
I denne fremstillingen er det representert ulike meninger rundt hva bildet representerer. Bildet er av et klesplagg, som det viser seg at folk oppfatter på ulike måter. 18…