
1051 Data visualizations Categorized "my city in data" (page 15 of 53)
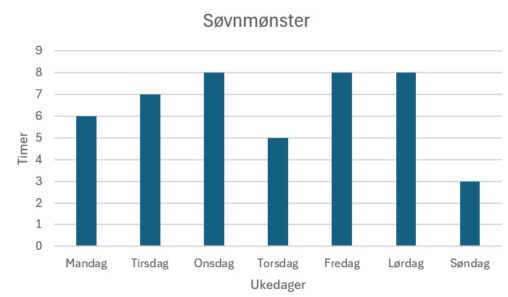
Denne visualiseringen viser mitt søvnmønster uke 35. Dataen er selvrapportert ved at jeg hver morgen noterte hvor mange timer jeg hadde sovet natten før. Den vertikale aksen representerer…
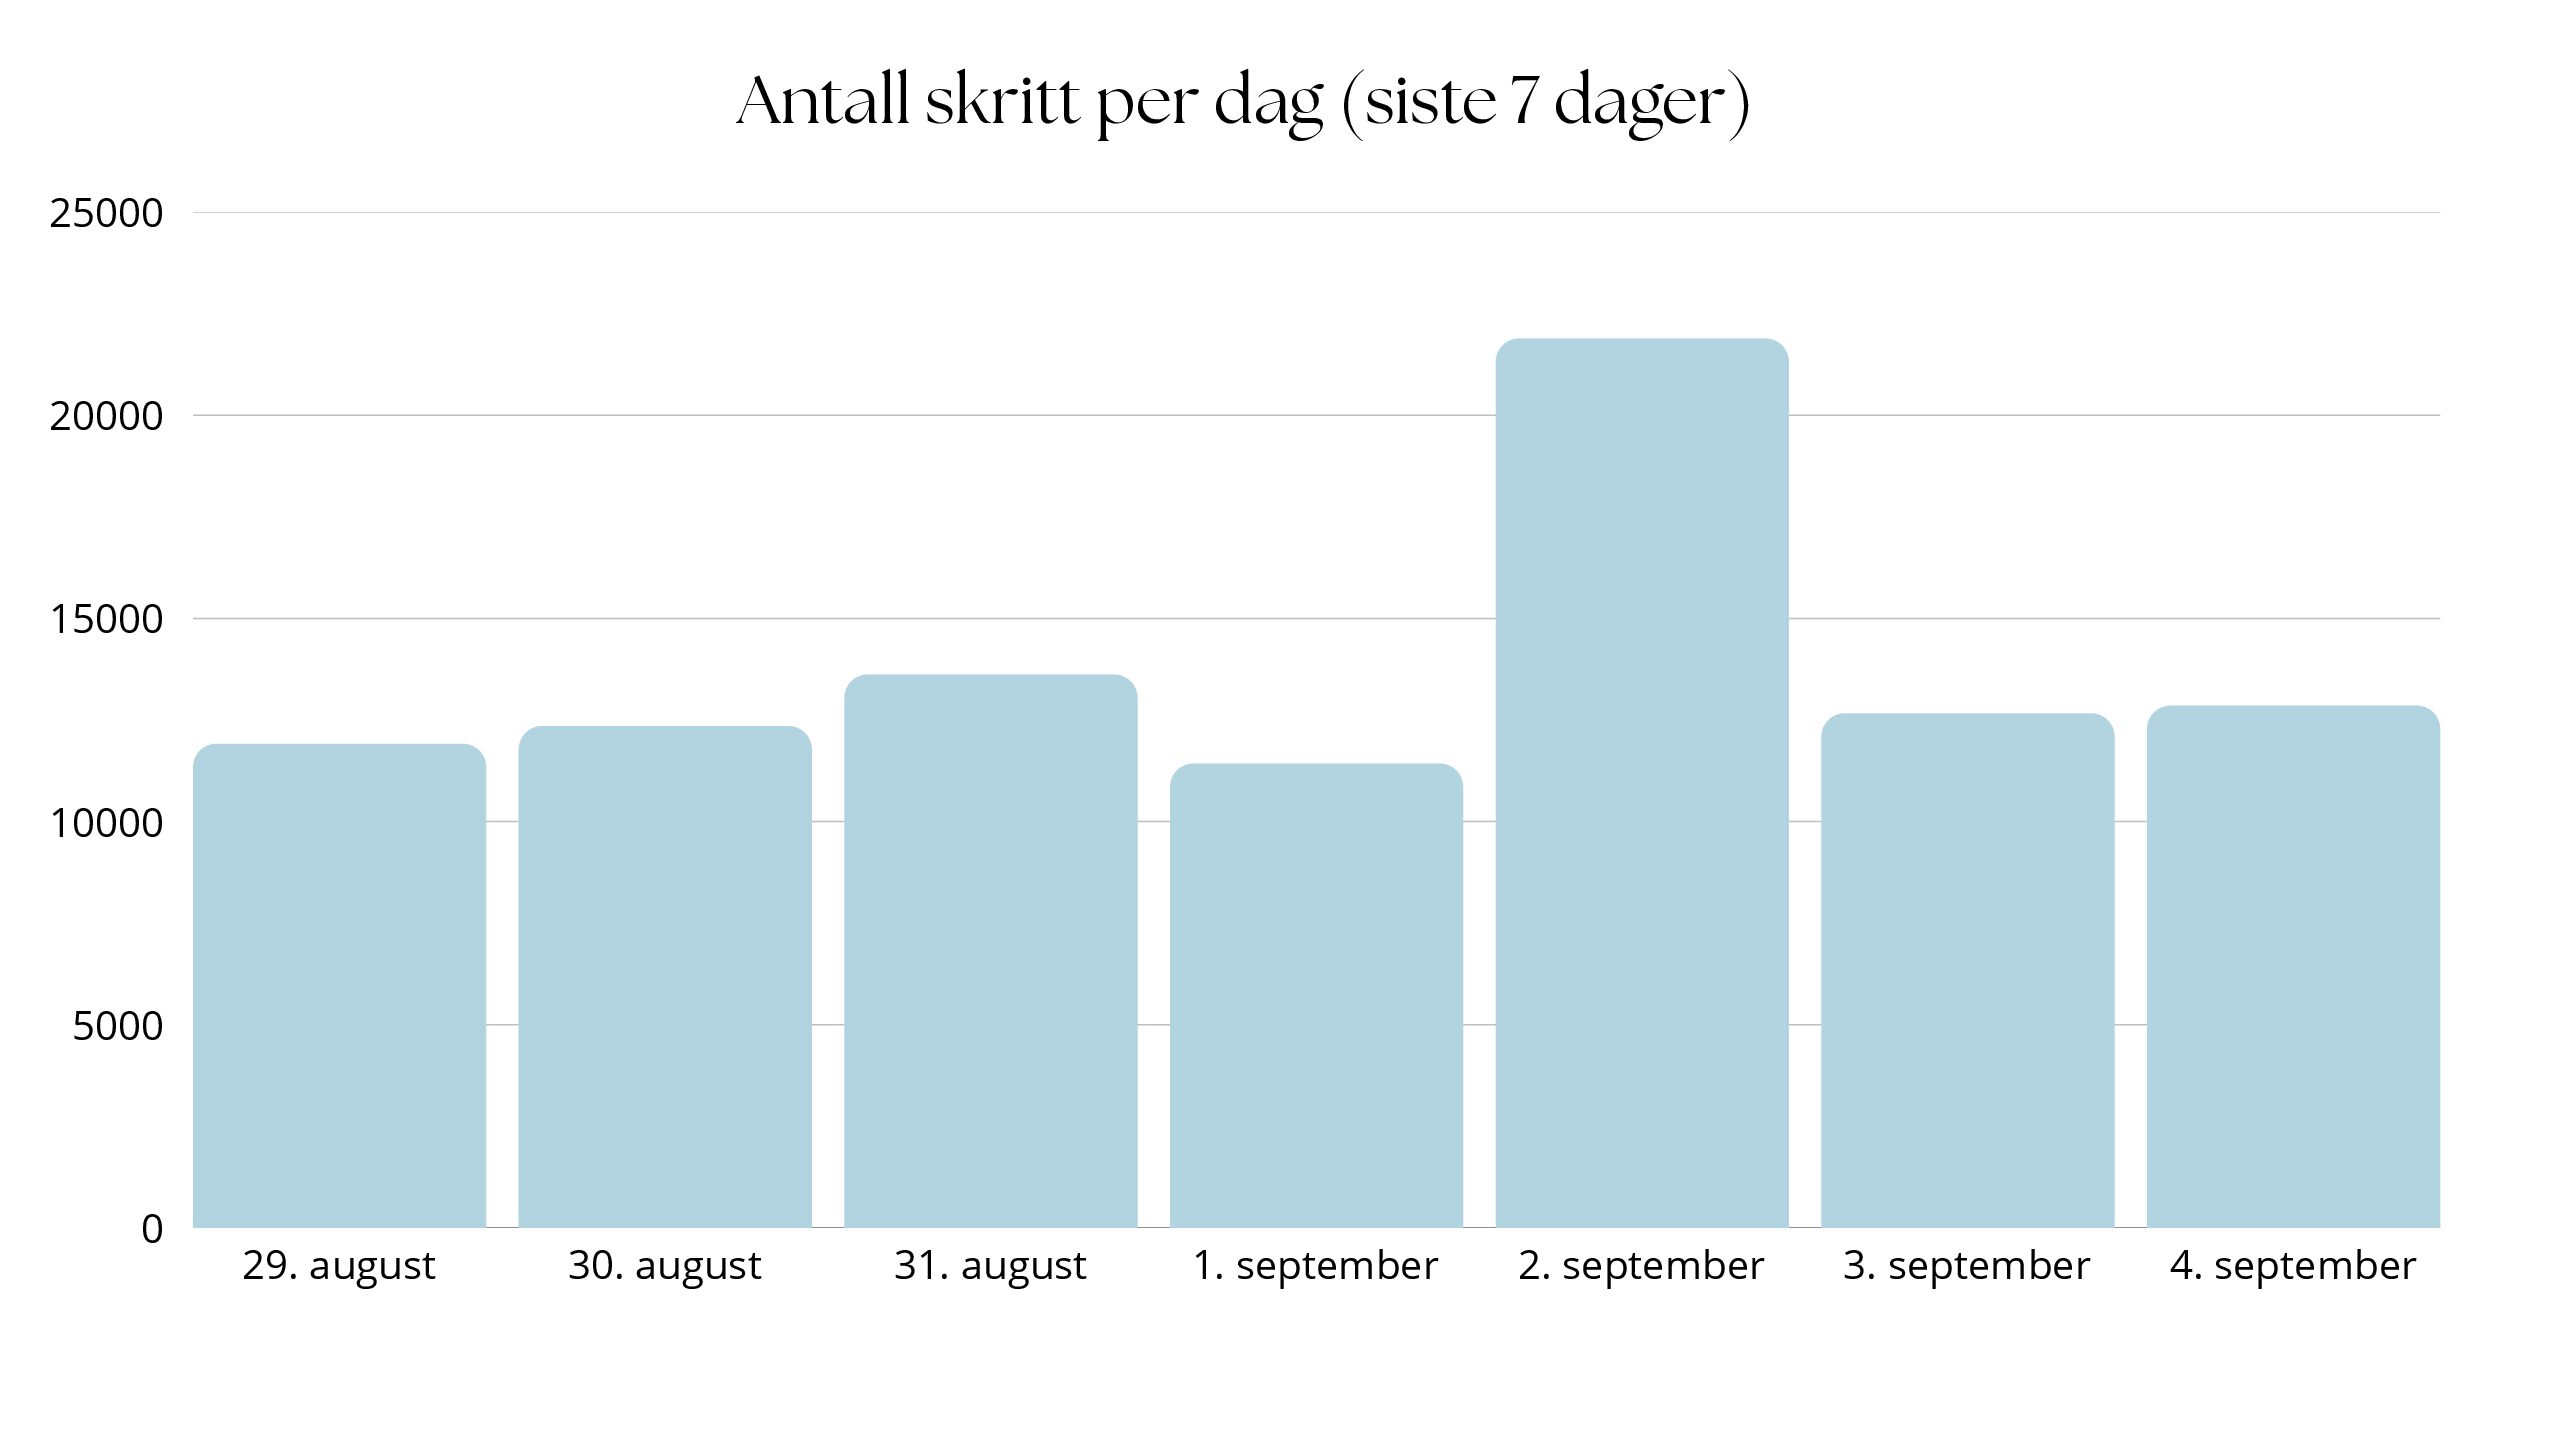
Antall skritt per dag, samlet inn via smartklokke over de siste 7 dagene.
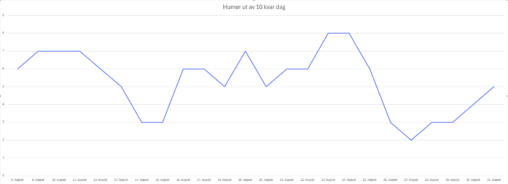
Grafen representerar humøret mitt på ein skala frå 1-10 sidan eg flytta til Bergen for å studere. Dataene er anonyme og kan brukast av andre. Eg har sjølv…
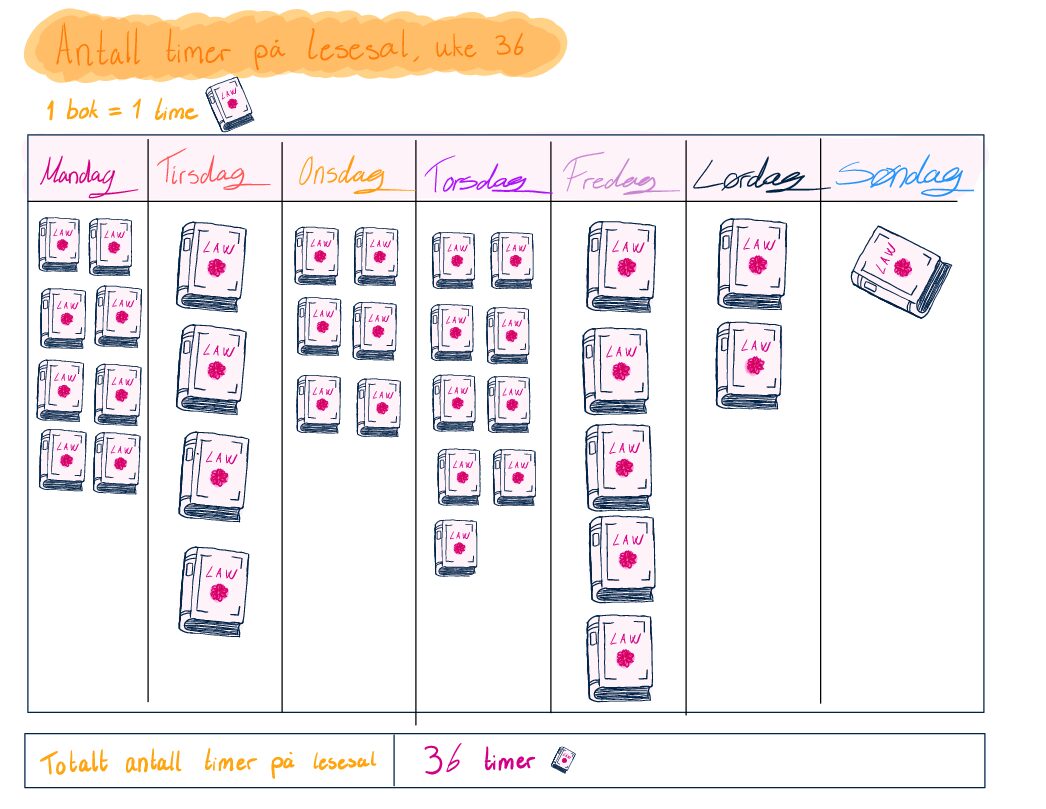
Her er en fremstilling av hvor mange timer jeg brukte i uke 36 på lesesal som jusstudent.

This photo was taken on a trip to Oslo when i was in hight school. I was taking photography for an extra course and it was something i…
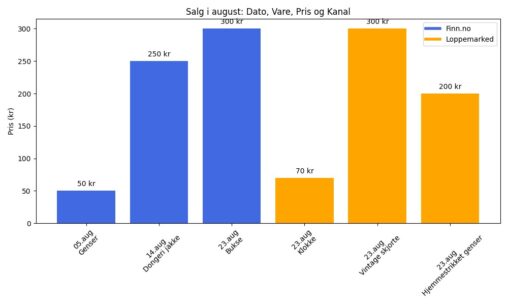
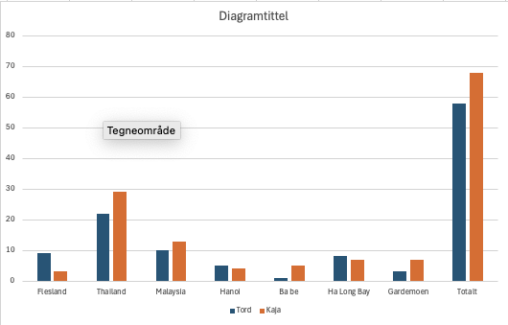
Oversikt over salg av ting fra Finn.no og Loppemarked for august måned (oppdatert)
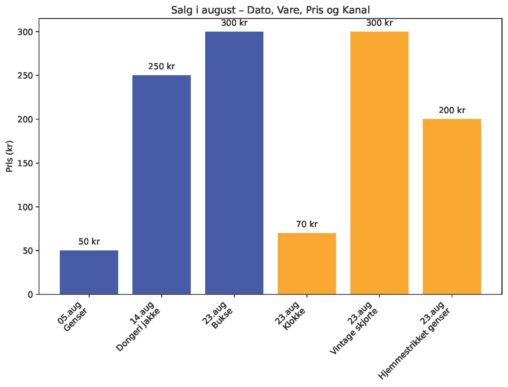
Oversikt over salg av egne ting fra Finn.no og Loppemarked for august måned.
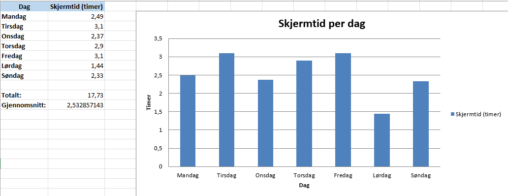
En oversikt over skjermtid brukt på min mobiltelfon over uke 35. Visualiseringen er gjort gjennom microsoft excel og dataene som er brukt er mine egne.
En presentasjon av antall seire i kortspill mellom meg og min kone på vår bryllupsreise
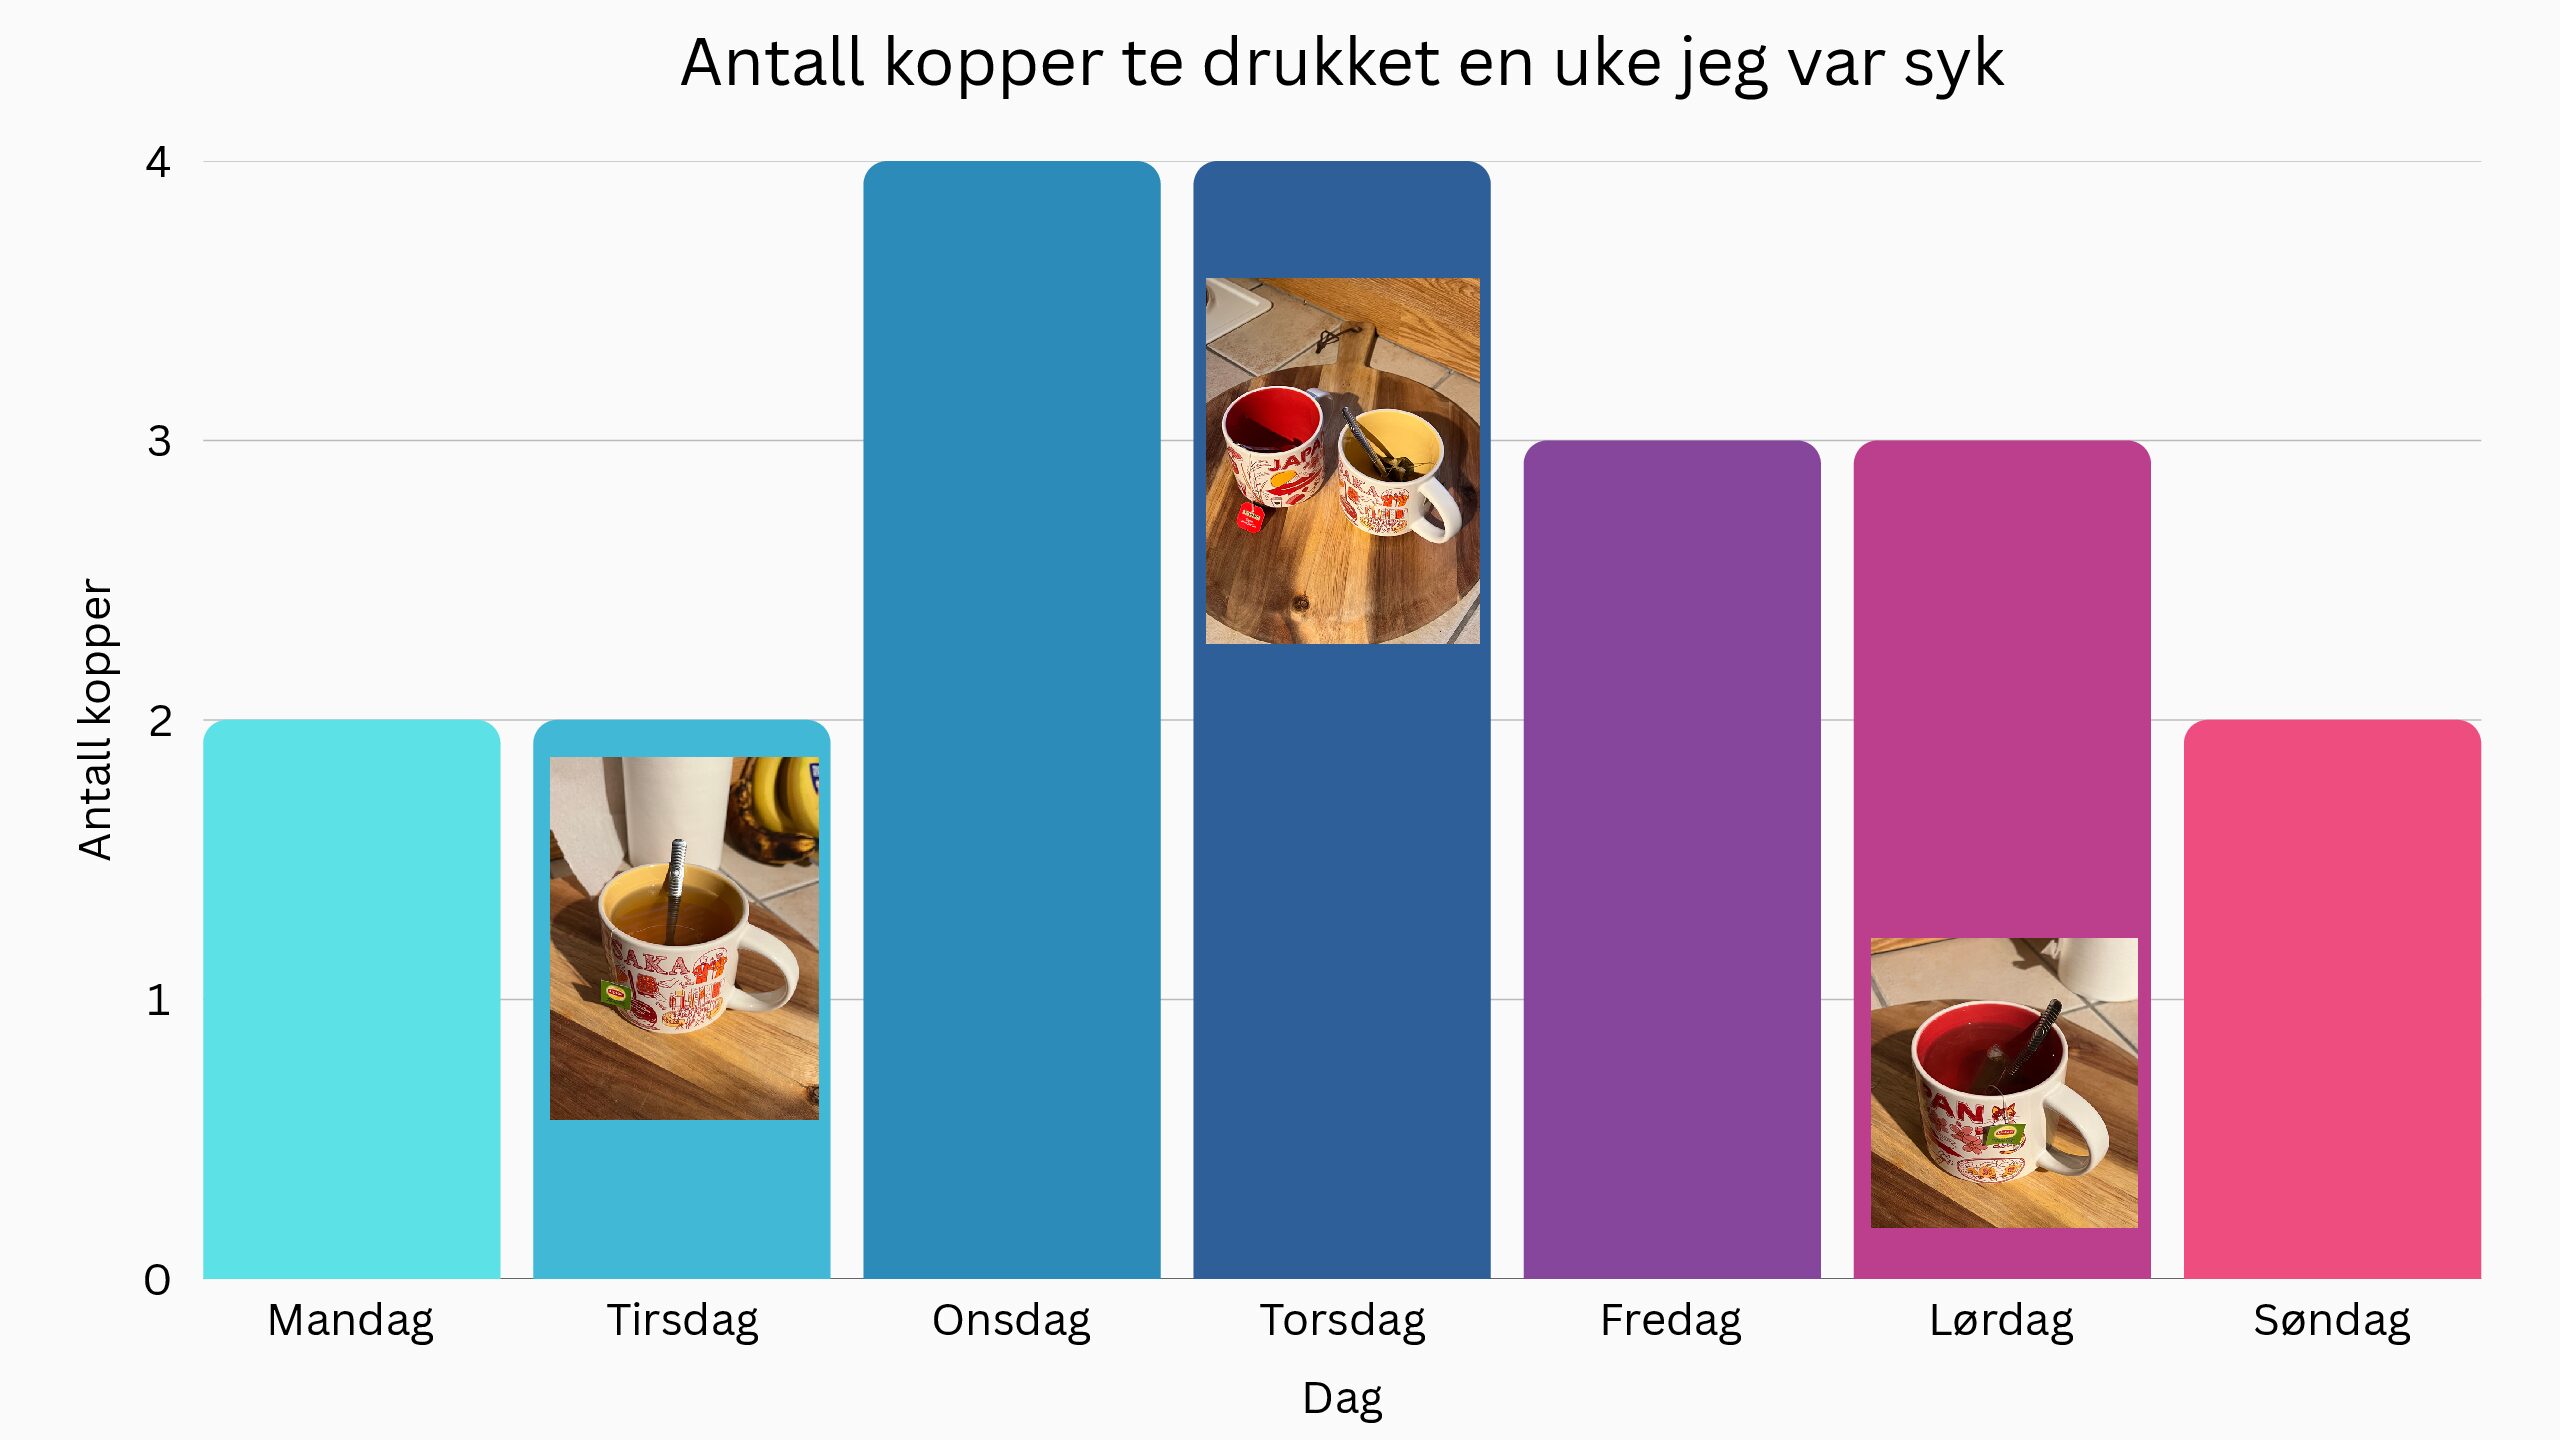
Dette er en graf som viser hvor mange kopper te jeg drakk hver dag en uke jeg var syk.
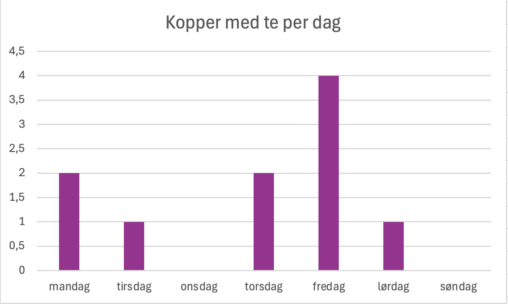
Dette diagrammet viser hvor mange kopper med te jeg har drukket per dag. Dataene er hentet fra en tilfeldig uke og er sortert fra mandag til og med…
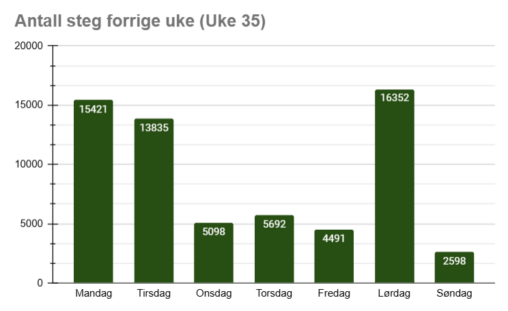
Bildet viser en bar chart over antall steg jeg tok hver dag forrige uke, fra den 25. august 2025 til den 31. august 2025. På mandagen jogget jeg…
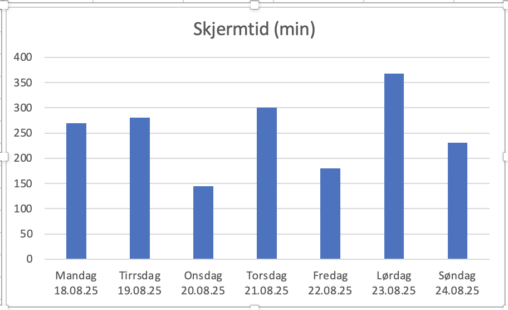
Her er skjermtiden for en tilfeldig valgt uke representert i form av et stolpediagram. Lagd via excel.
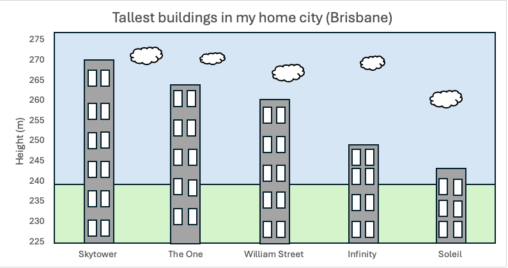
Tallest buildings in my home city represented by height in meters. Graph and visualization made through Microsoft word and excel
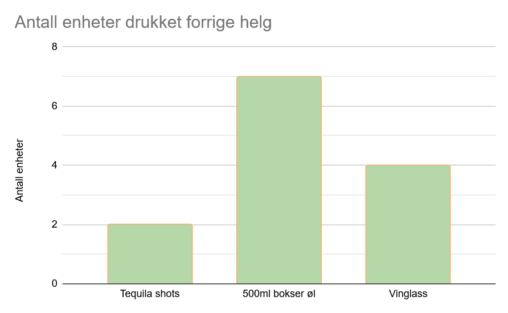
Visualisering av antallet enheter av forskjellige typer alkohol som jeg tok inn forrige helg. Public Domain.
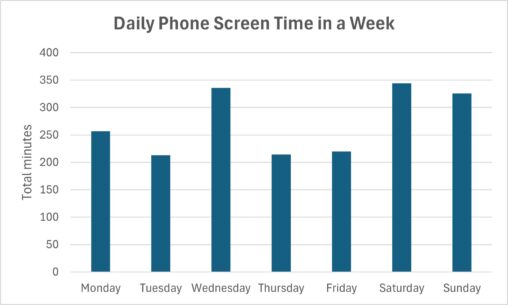
Here is a representation of the total amount of minutes I spent on my phone (screen time), daily through a week.
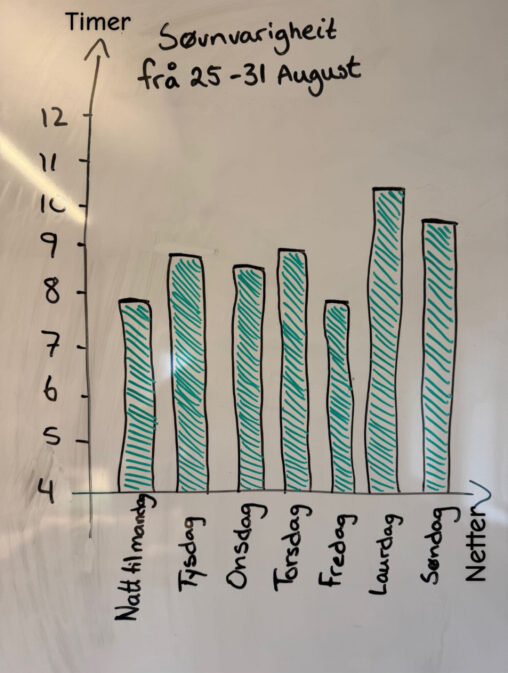
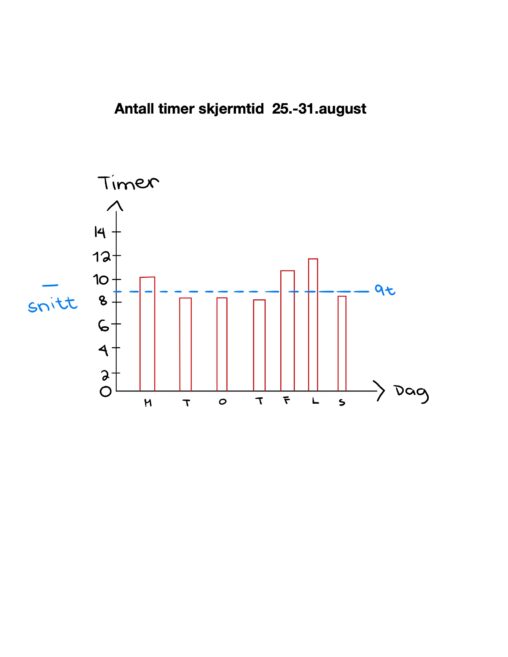
Dette stolpediagrammet viser talet på timar søvn eg har fått kvar natt i perioden 25.–31. august 2025. Kvar stolpe representerer ein dag, og høgda på stolpen viser søvnlengda…
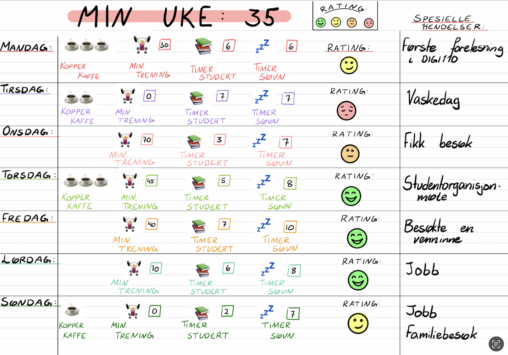
Viser min uke 35 Liker å ha en oversikt over ting som trening og søvn så ville lage tabell over dette