
1050 Data visualizations Categorized "my city in data" (page 14 of 53)
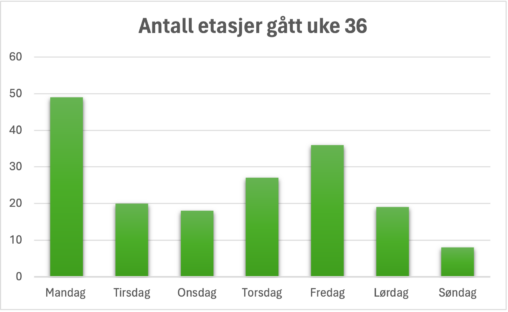
The chart visualizes the number of apartment floors I walked in week 36.
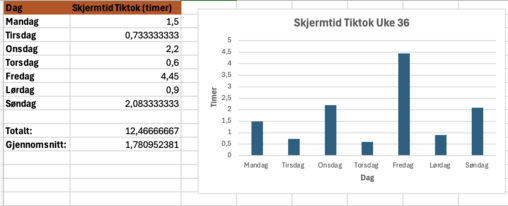
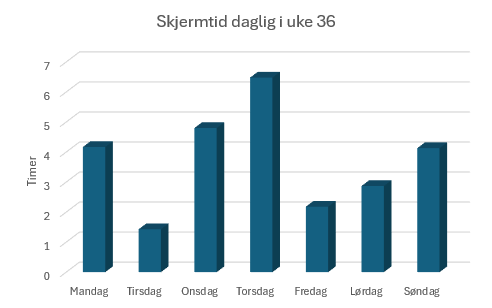
Diagrammet viser en oversikt over antall timer skjermtid på y-akse og dagene i uken på x-aksen, antall timer blir vist på grafen i desimaler regnet om fra timer…
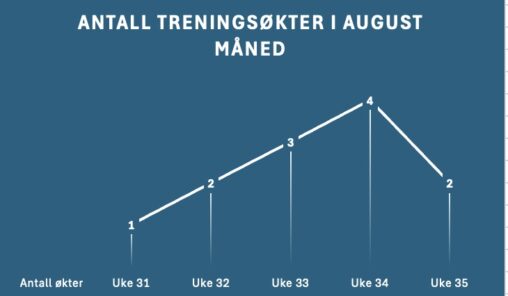
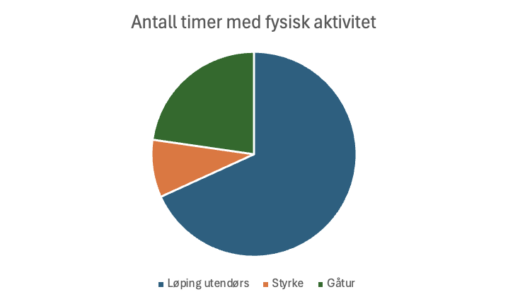
Jeg har selv en oversikt i min fysiske kalenderbok over hvor mange trenignsøkter jeg gjør i løpet av uken/måneden. Dette er dataene samlet fra august måned satt inn…
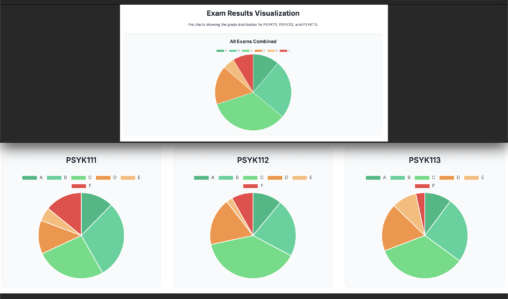
Data Visualization Description This visualization represents the grade distribution for the PSYK111, PSYK112, and PSYK113 courses from the fall 2024 semester. The data, which includes the number of…
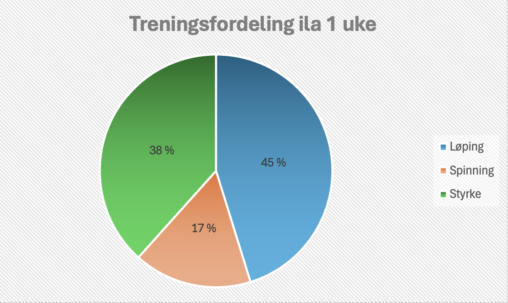
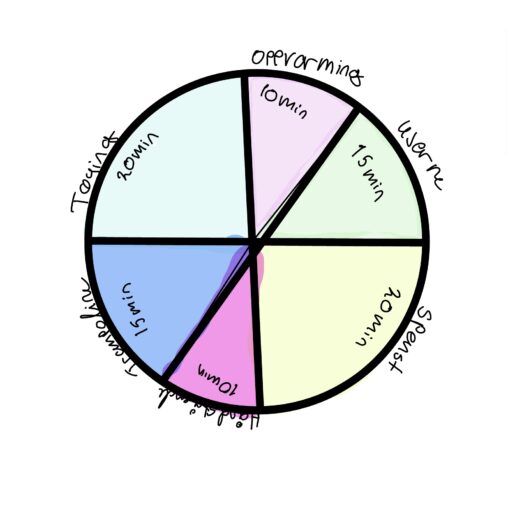
Dette er et sektordiagram som viser fordelingen av minutter jeg har brukt på ulike treningsformer sist uke.
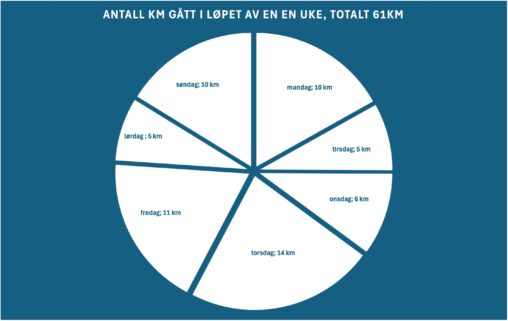
Det som blir representert på kakediagrammet er antall kilometer jeg har gått i løpet av en uke fordelt på de forskjellige dagene. Hvert kakestykke representerer en dag i…
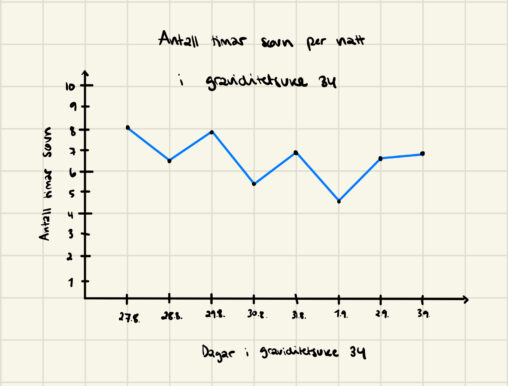
Visuell presentasjon av antall søvntimer per natt i graviditetsuke 34 for å visualisere hvor varierende søvnmengde gravide i 3. trimester får.
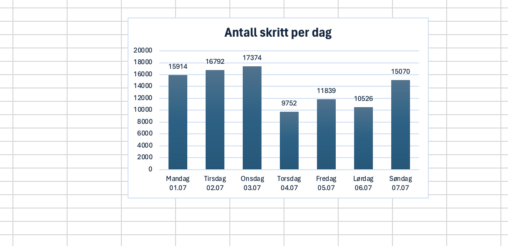
En visualisering av antall skritt jeg har gått den siste uken, målt med min sportsklokke.
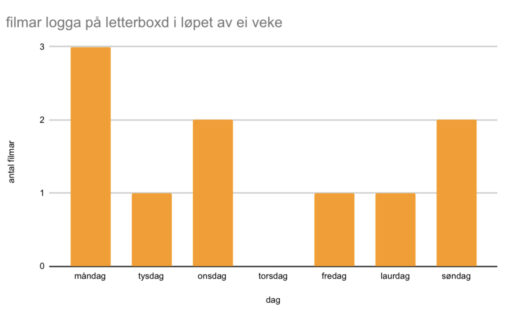
Den horisontale aksen representerer dei ulike dagane denne veka. Den vertikale aksen representerar antal filmar sett. Måndag var dagen eg har sett mest film (3), torsdag var dagen…
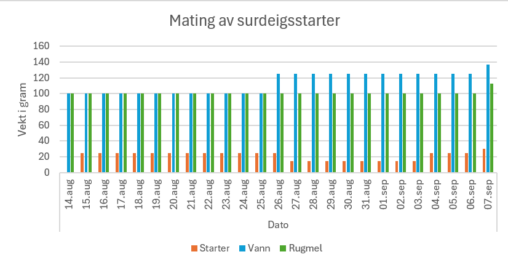
Dataene er en visualisering av matingsrutinene av en nystartet surdeigsstarter fra 14. august til 7. september med informasjon om vekt av ulike ingredienser tilsatt.
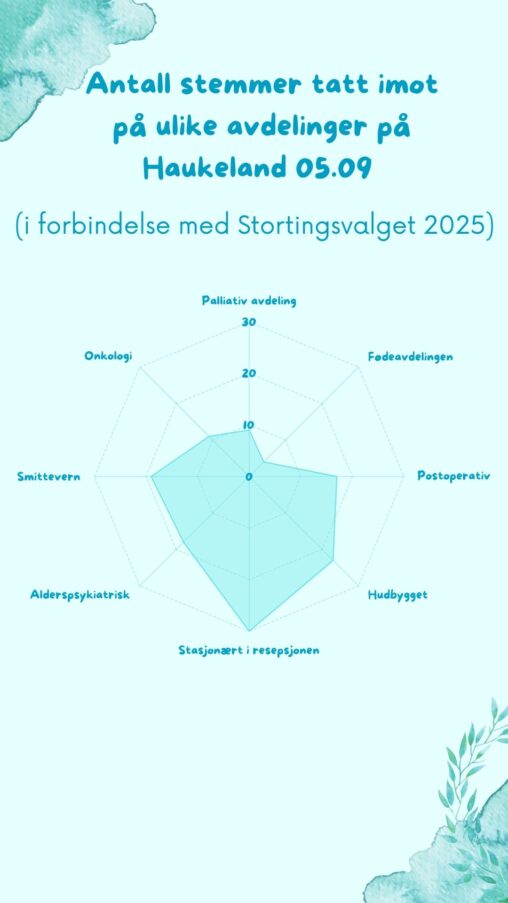
Visualisering av antall stemmer tatt imot på Haukeland sykehus den 05.09.2025 i forbindelse med Stortingsvalget. Dataen er innhentet av meg på arbeidsdag som valgadministrator og stemmemottaker ved forhåndsstemming…
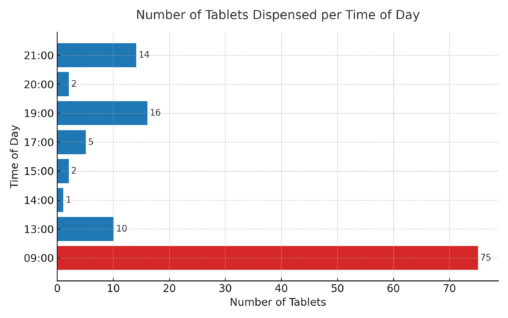
Description: The visualization shows the number of tablets dispensed by nurses in a short-term care unit (rooms 1–10) at different times of the day. Data represent a single…
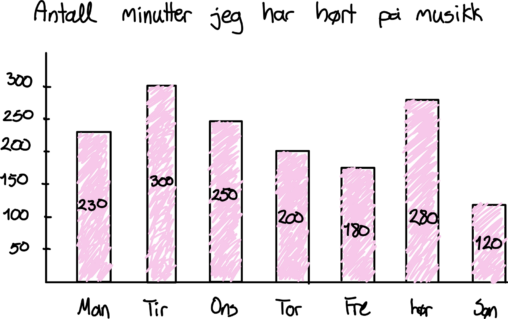
Antall minutter jeg har hørt på musikk i løpet av en tilfeldig uke.
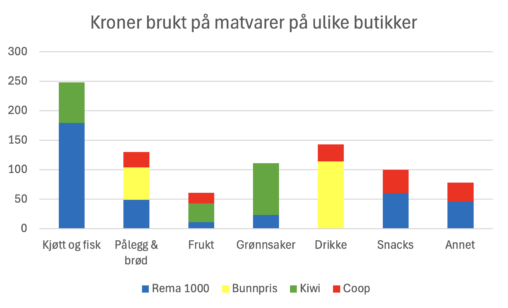
Alle handleturer til matvarebutikker i uke 35. har blitt samlet opp, og matvarene er fordelt i ulike kategorier. Disse er lagt sammen, og visualiserer også hvilken matvarebutikk de…
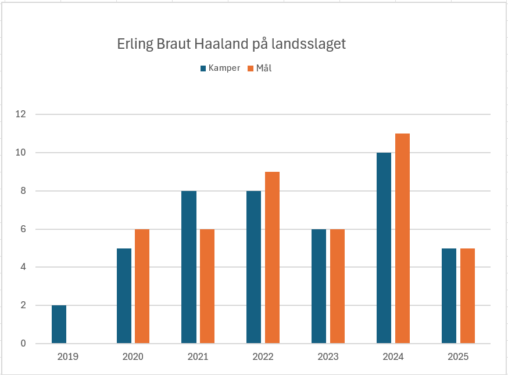
Grafen viser antall kamper og mål Haaland har scoret på landsslaget siden han debuterte på landsslaget i 2019.
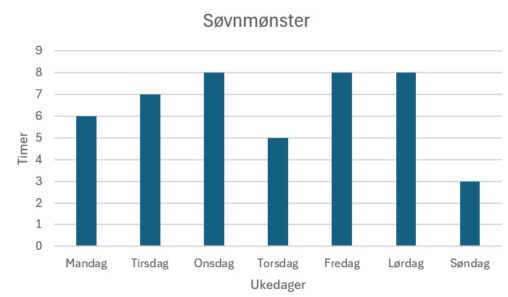
Denne visualiseringen viser mitt søvnmønster uke 35. Dataen er selvrapportert ved at jeg hver morgen noterte hvor mange timer jeg hadde sovet natten før. Den vertikale aksen representerer…