
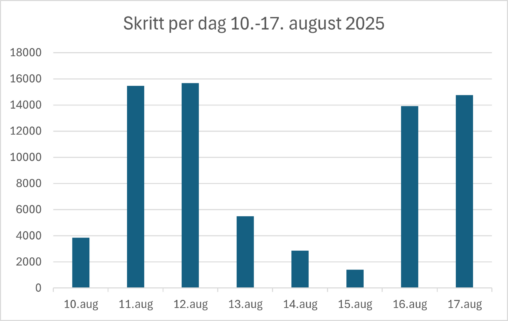
1051 Data visualizations Categorized "my city in data" (page 12 of 53)
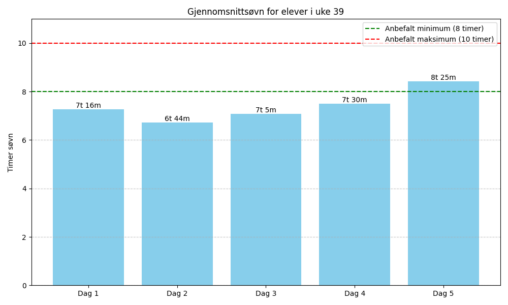
I faget Helsefremmende skulle 17 elever måle søvnvaner i 5 valgfrie døgn i uke 39. Aldersgruppen er 16 – 18 år. I følge læreboken =HO Helse, Vg1 Helse-…
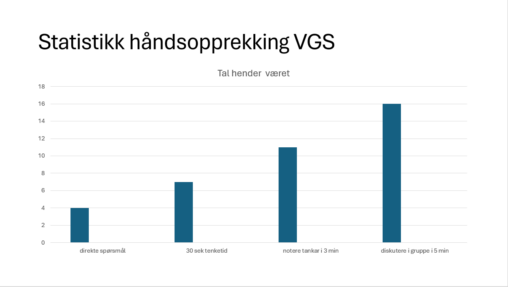
Respons frå elevane mine med ulike metodar. 30 elevar i klassen. Konklusjon: Direkte spørsmål, altså den klassiske metoden der lærar spør klassen “ut i lufta” og peiker på…
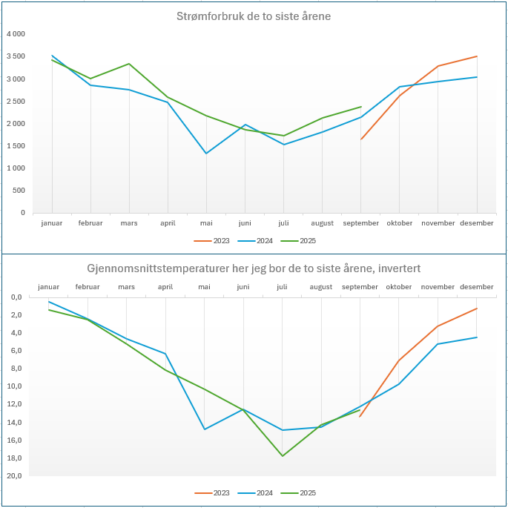
Strømdata hentet fra BKK, gjennomsnittstemperatur hentet fra Yr. Data skrevet inn i Excel for visualisering. Temperaturskalaen er invertert for å lettere se om det er noen direkte kobling…
Respons frå elevane mine med ulike metodar. 30 elevar i klassen. Konklusjon: Direkte spørsmål, altså den klassiske metoden der lærar spør klassen “ut i lufta” og peiker på…
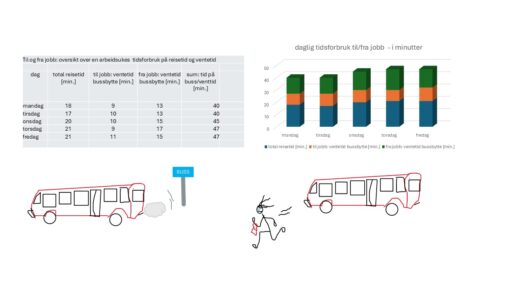
En ukes daglige tidsforbruk (i minutter) på bussreiser, inkludert ventetid ved bussbytte.
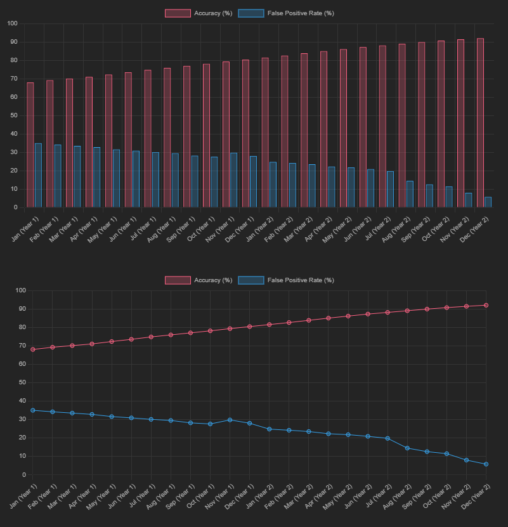
Denne grafen viser den månadlege ytinga til ein modell eg har laga for å oppdage phishing epostar. Nøyaktigheit og falsk positiv rate er viste, og syner kor effektivt…
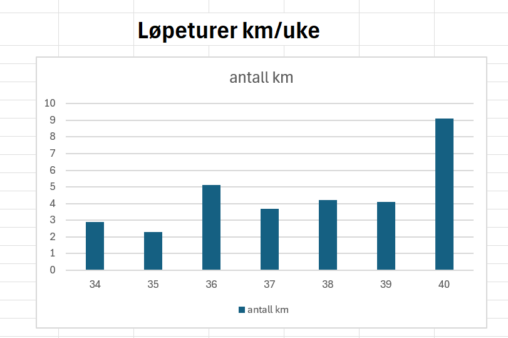
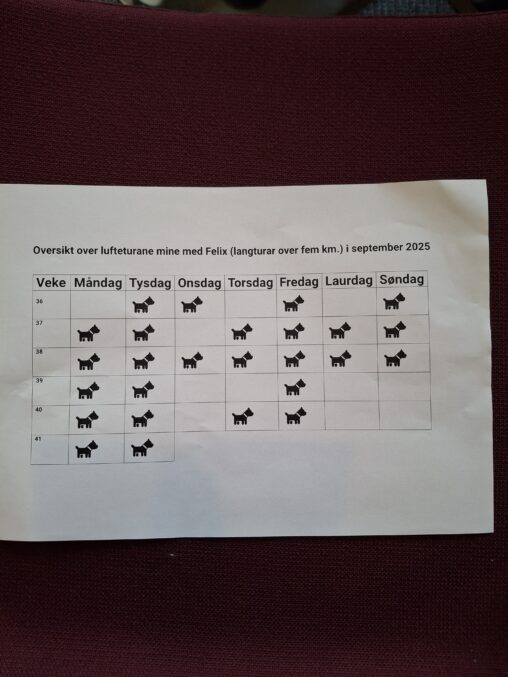
Stolpediagram for løpeturer antall km/uke Data hentet fra lagret data fra Connect-app (fra Garmin-klokka), diagrammet er laget i Excel. Diagrammet representerer utvikling av lengde løpeturer i period fra…
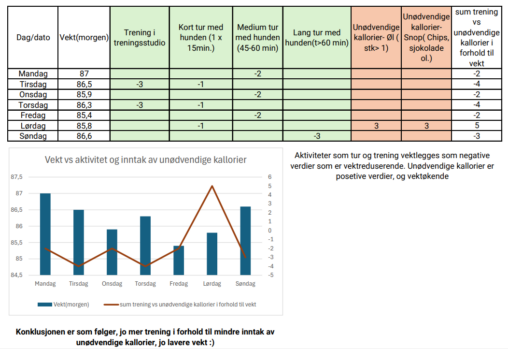
Vekt vs. aktivitet og inntak av unødvendige kallorier i løpet av en uke. Konklusjonen er som følger, jo mer trening i forhold til mindre inntak av unødvendige kallorier,…
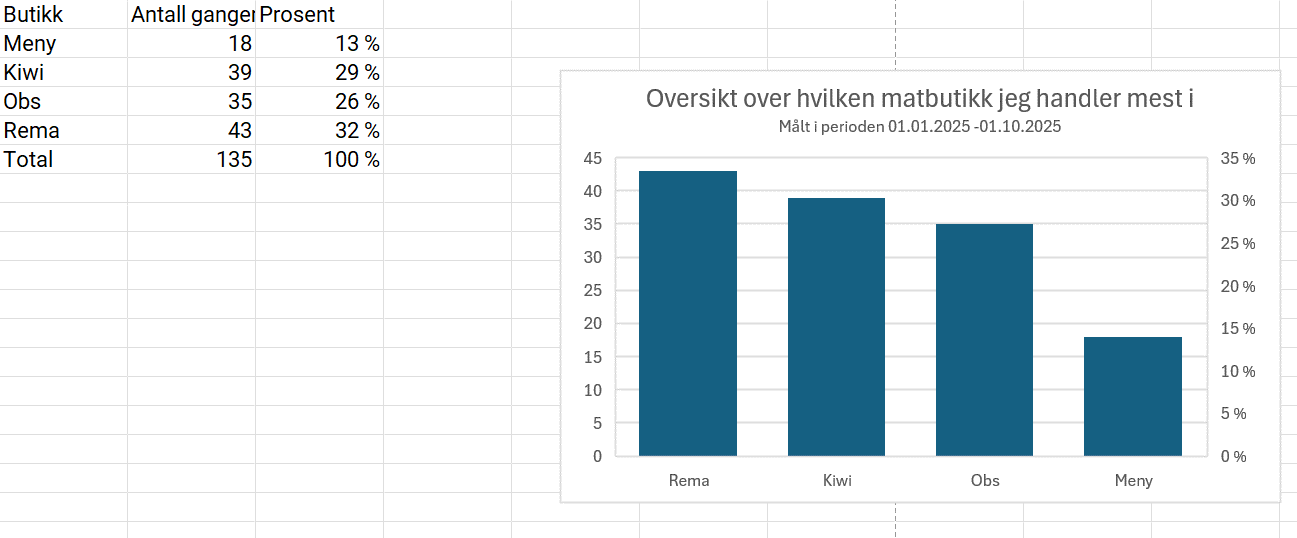
Data fra apper tilknyttet matvarebutikker, og min bruker. Antall handleturer Dato periode
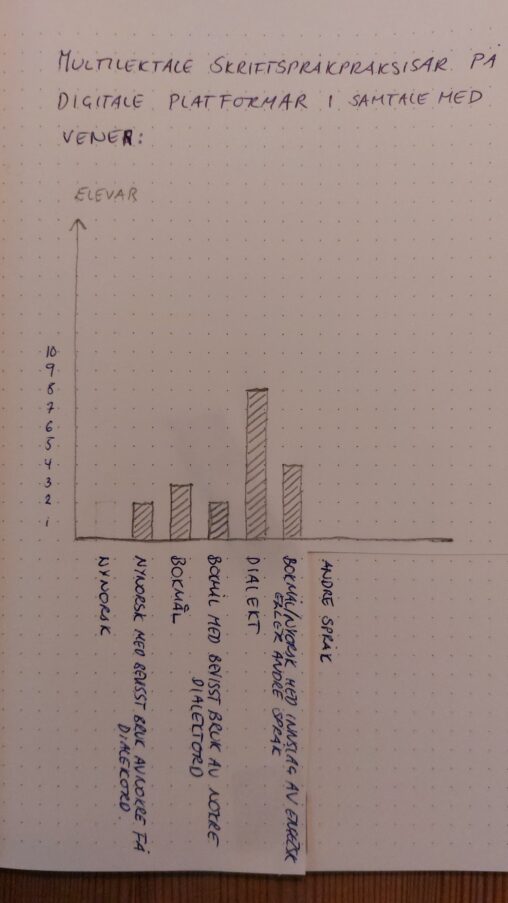
Diagrammet viser kva elevar svarer på spørsmålet “Når du chattar eller skriv sms til vener, kva språk brukar du? (Svar det du brukar mest)”

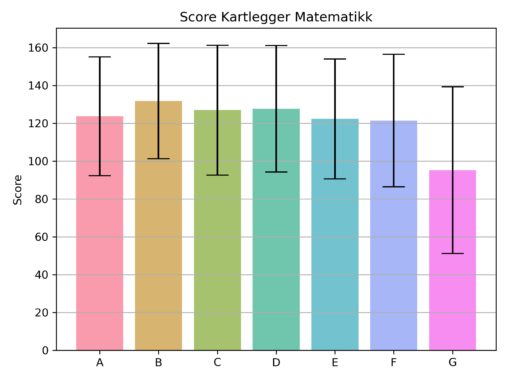
Diagrammene viser ulike førsteklassers score på kartleggingstesten i matematikk. Resultatene presenteres som gjennomsnitt med standardavvik
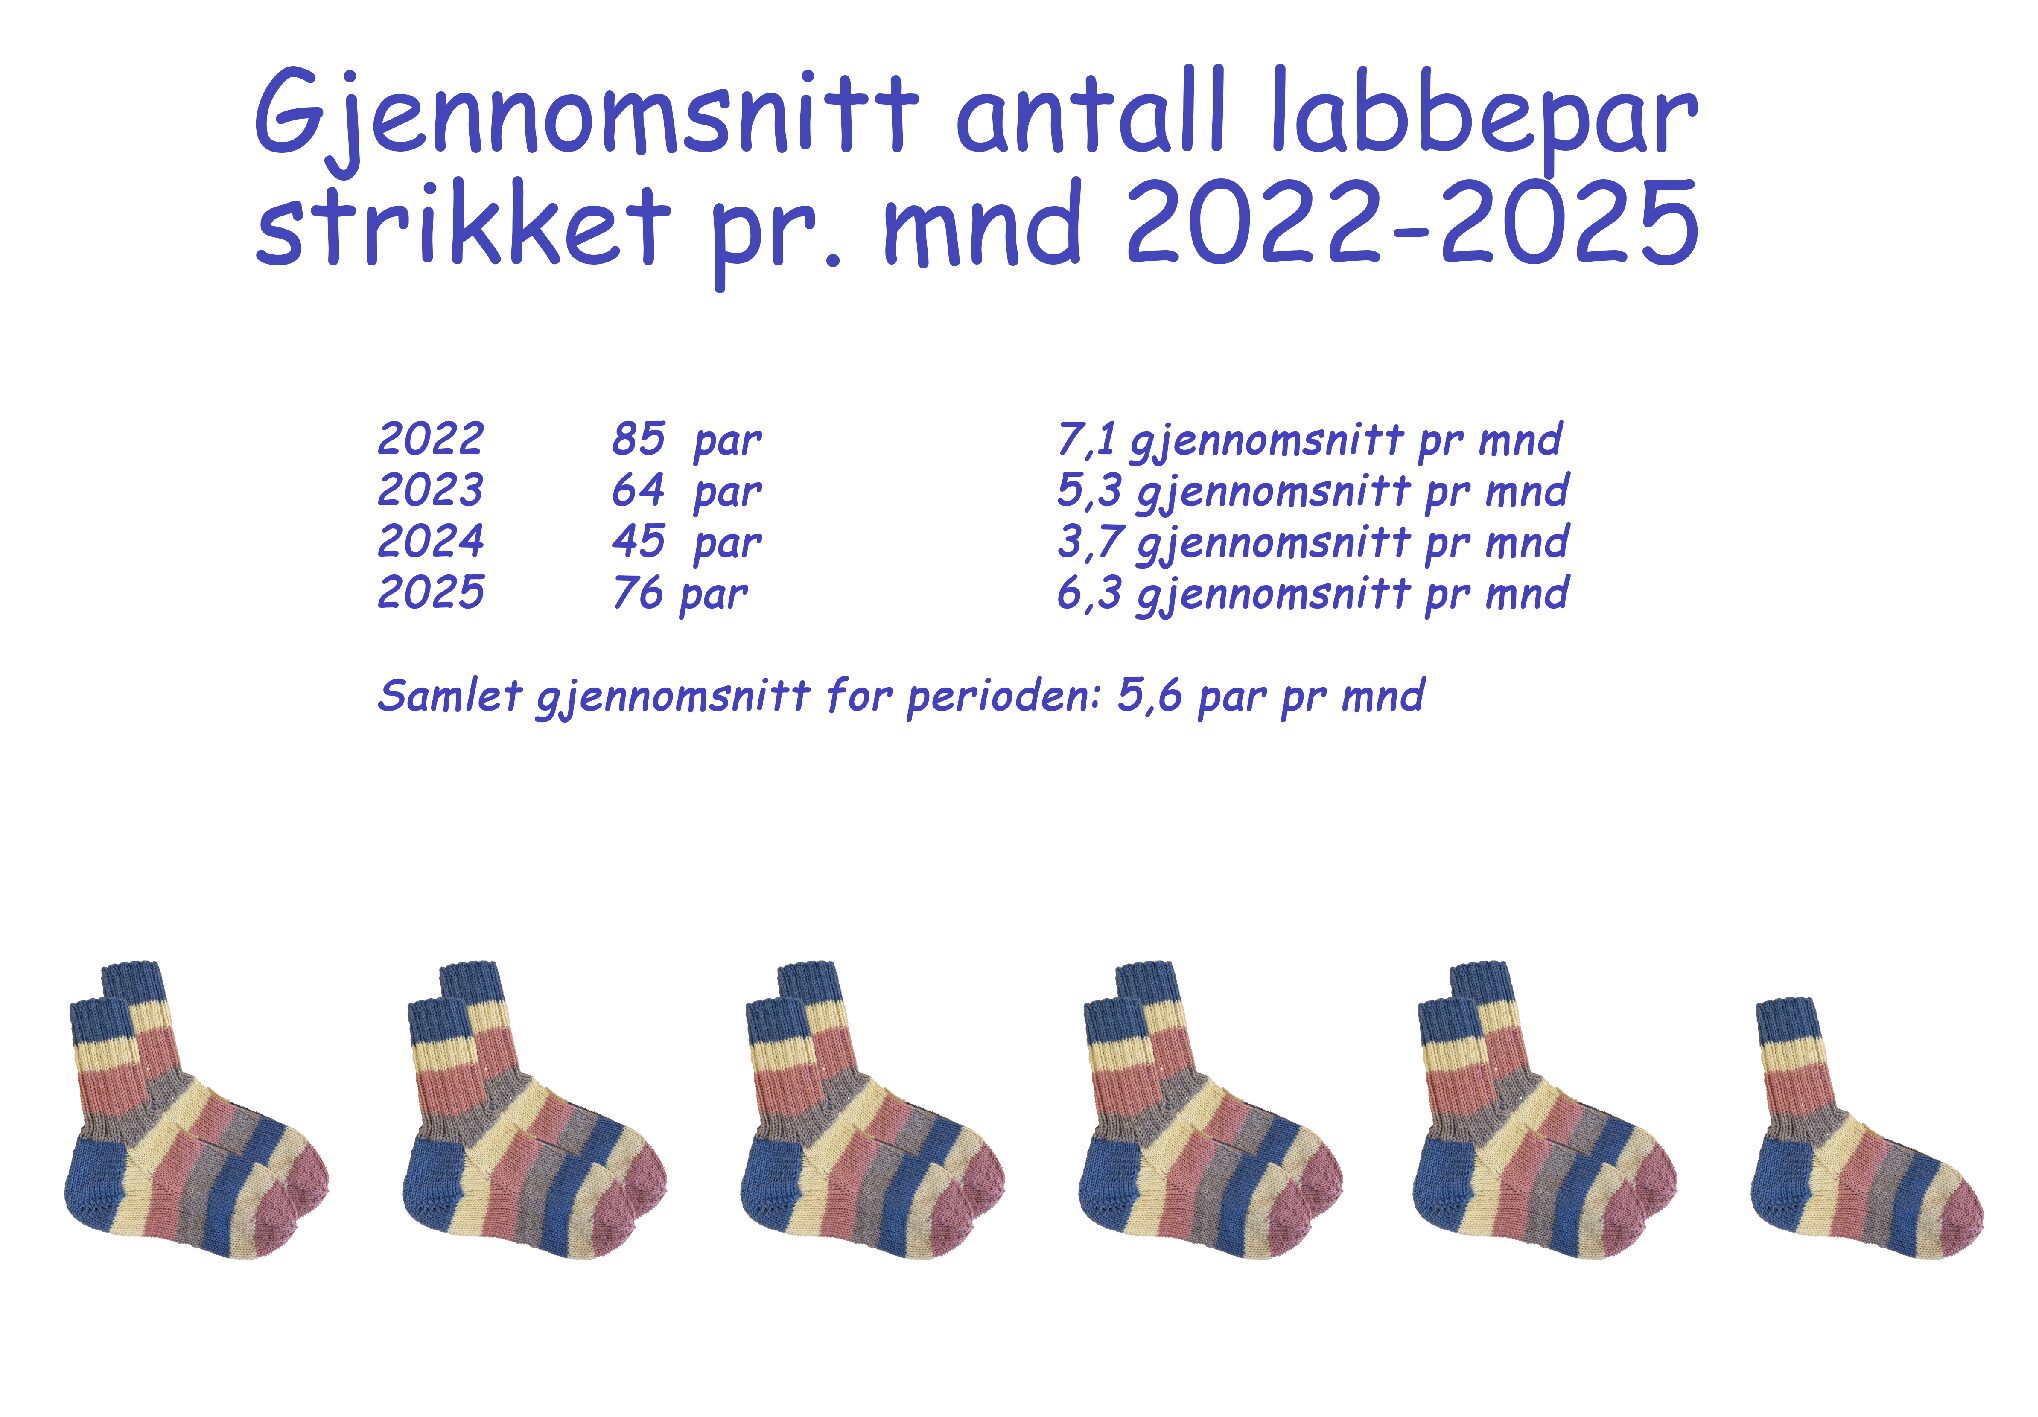
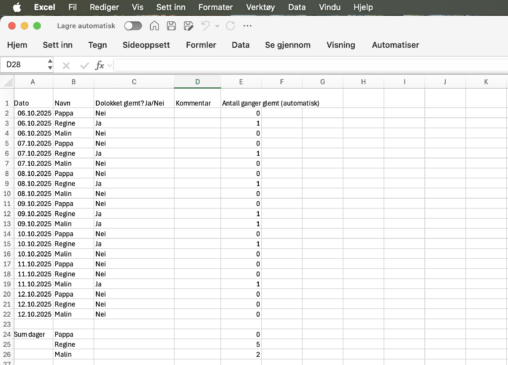
Jeg stikke mange labber og selger disse labbene til en liten butikk. I den forbindelse har jeg et eget lite regnskap over hvor mange labber jeg har solgt…
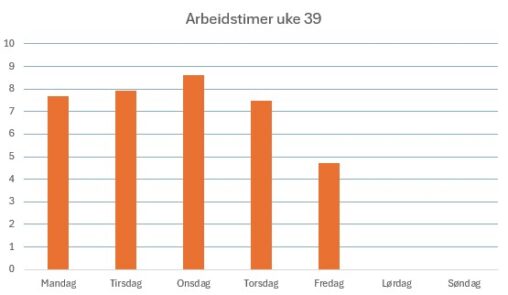
My working hours last week put in to Excel. After that I created a table for a visual presentation
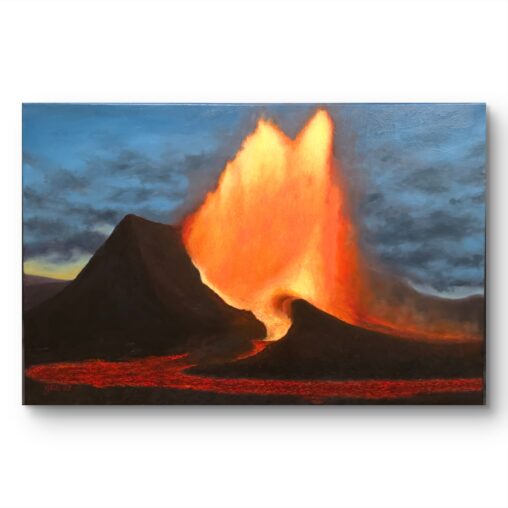
Dette er et maleri av et islandsk vulkanutbrudd, som jeg malte i for svigerinnen min i 2025. Hun er geolog og er veldig glad i vulkaner. Maleriet fikk…