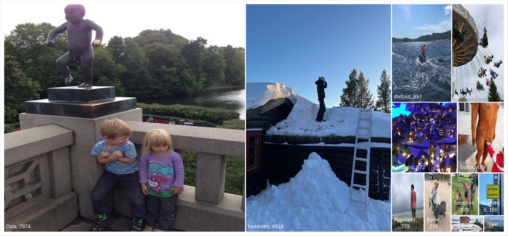
74 Data visualizations Categorized "65+" (page 1 of 4)
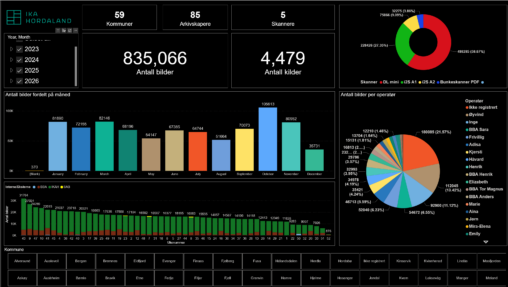
Dette er en visualisering av data over produksjon i kulturarv digitisering gjennom tid. Den gir en oversikt over antall bilder, kilder som er skannet, hvem som er operatør…
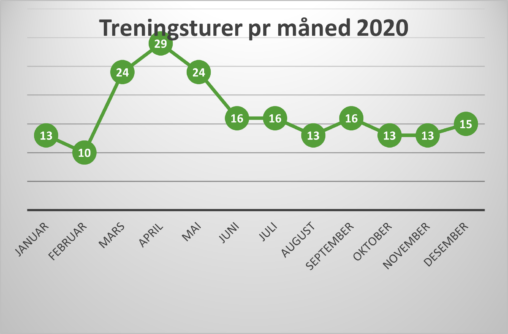
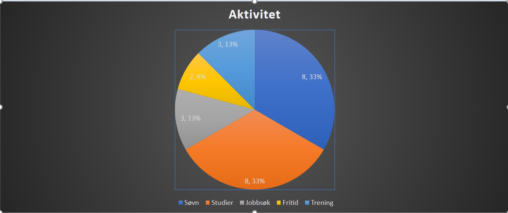
Months and number of work out hours. I am the owner of the data I have visualized.
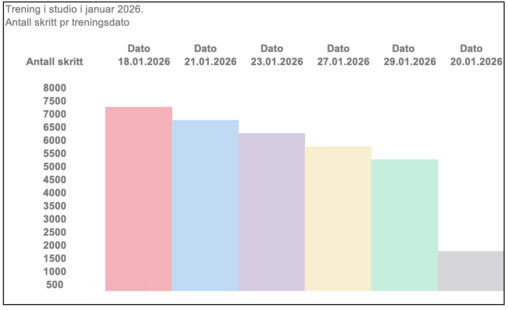
SPENST PROVIDED DATA ON dates I attended the studio. My Oura Ring 4 provided steps per work out session in January
Flateproporsjonal vising av antall bilder tatt i hver fylke.
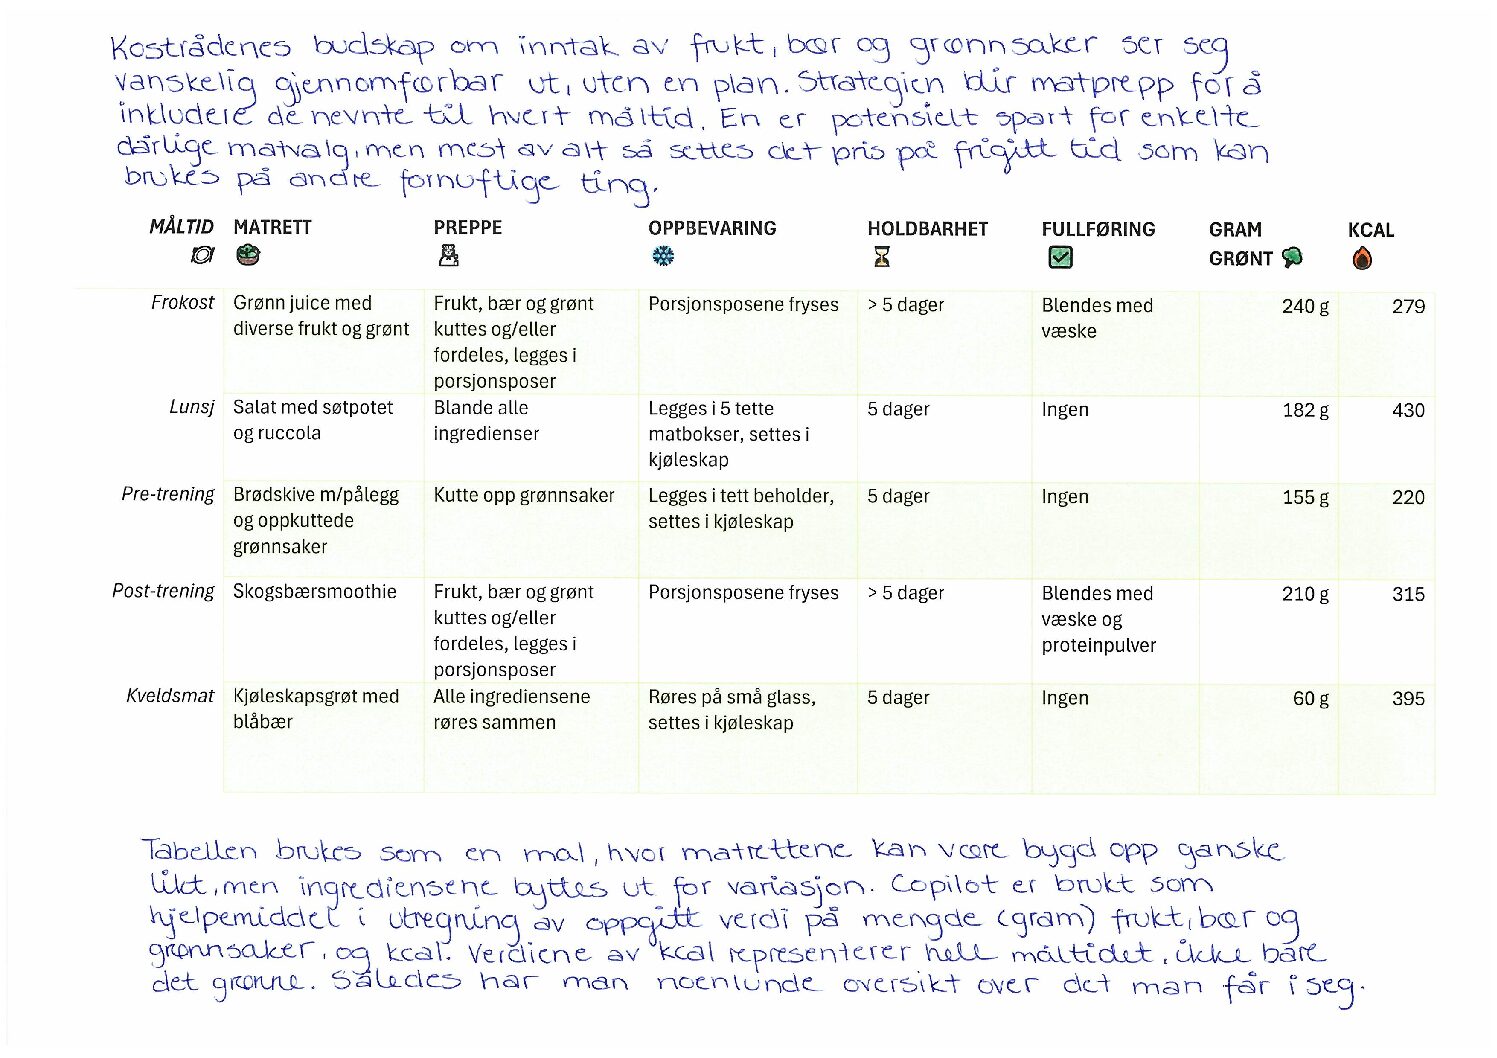
Visualiseringen er laget med bakgrunn i mål om å få i seg rundt 800 gram frukt, bær og grønnsaker hver dag. Dette med opphav i nåværende kostholdsråd, da…
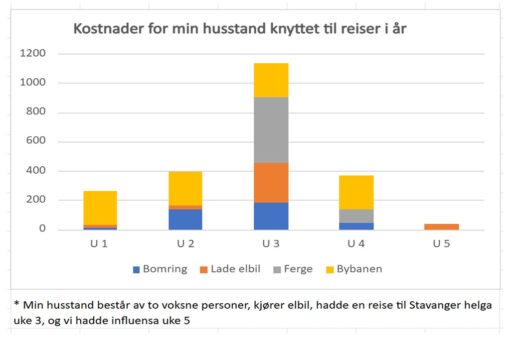
My family is represented by me and my wife, 2 persons. I have collected data from apps that shows my use of lectric power for charging my car,…
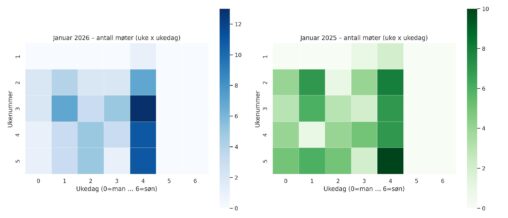
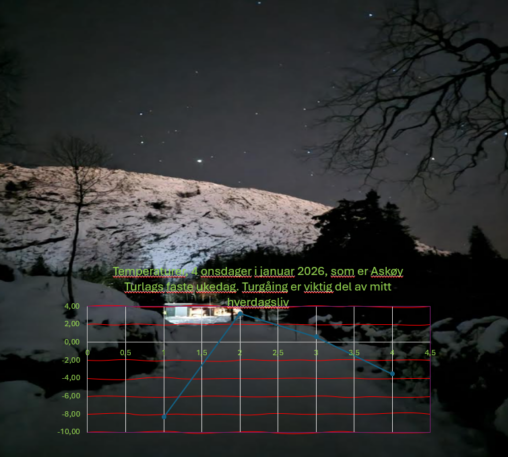
Antall møter per ukedag per uke i januar for både 2025 og 2026, basert på data fra business kalenderen. To varmekart side‑om‑side, der hver rad er ukenummer og…
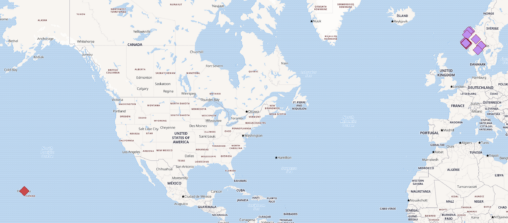
Basert på kundedata fra WordPress, en geo lookup plugin og QGIS, viser kartet hvor kunder har bestilt barneboken min. Dataene er eksportert fra nettbutikken. Takket være en venn…
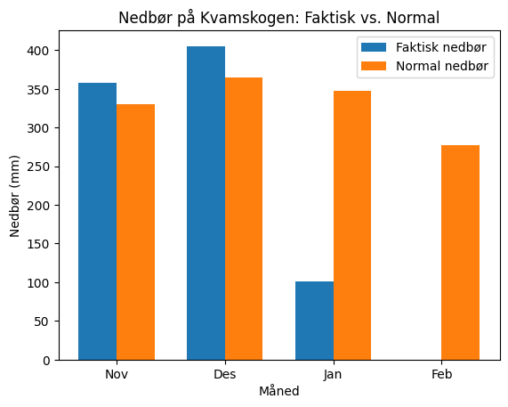
Visualiseringen viser at nedbøren på Kvamskogen var høyere enn normalen i november og desember 2025, mens januar og februar 2026 hadde betydelig lavere nedbør enn normalen.
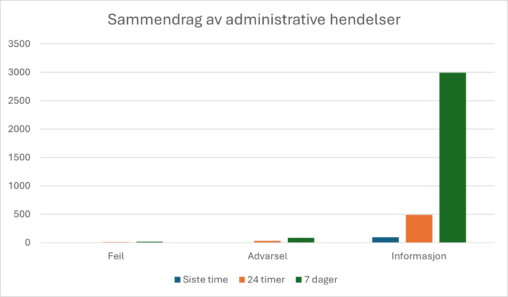
Administrative hendelser er en filtrert oversikt over hendelser hentet fra en rekke logger som datamaskinen holder oversikt over, fra blant annet system, applikasjoner, sikkerhet og oppsett. Den viser…
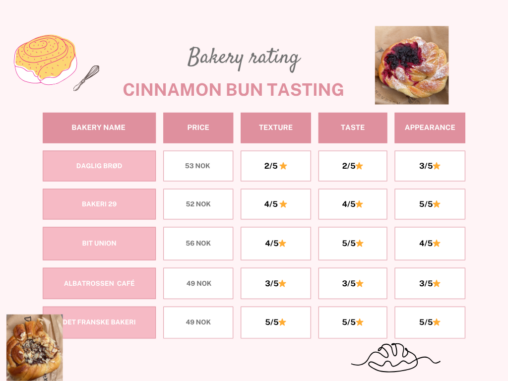
This is a rating of Cinnamon Buns in 5 of Bergens Bakeries. The image is created with Canva.com
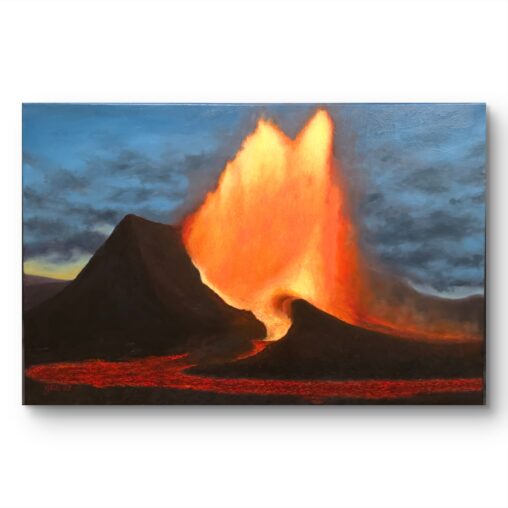
Dette er et maleri av et islandsk vulkanutbrudd, som jeg malte i for svigerinnen min i 2025. Hun er geolog og er veldig glad i vulkaner. Maleriet fikk…
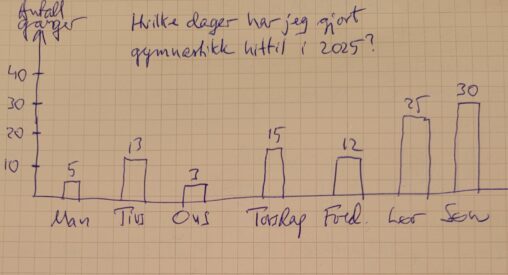
Figuren viser på hvilke ukedager jeg foretar gymnastikk, hittil i år. Eier data selv.
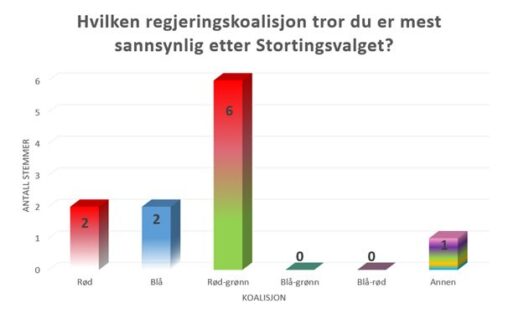
Spørreundersøkelsen ble gjennomført via Google Forms blant ansatte på Seksjonen for økonomi, NT, UiB. Per 6. september 2025 var det registrert 11 stemmer. Deltakerne kunne velge mellom følgende…
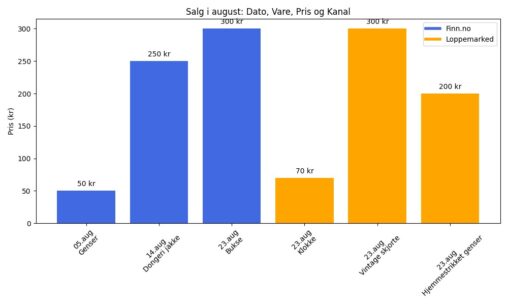
Oversikt over salg av ting fra Finn.no og Loppemarked for august måned (oppdatert)
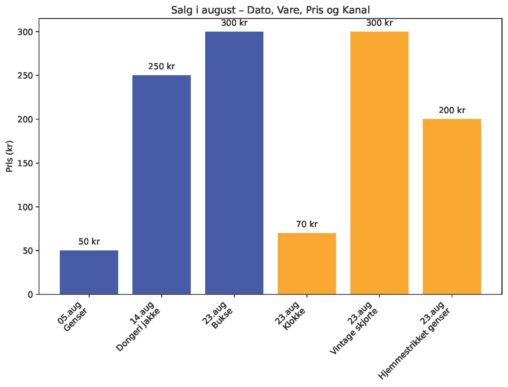
Oversikt over salg av egne ting fra Finn.no og Loppemarked for august måned.
Kilden til disse dataene er mine egne personlige dokumenter. derfor er de min eiendom og er ikke beskyttet av opphavsrett.