
1466 Data visualizations Categorized "30-64" (page 8 of 74)
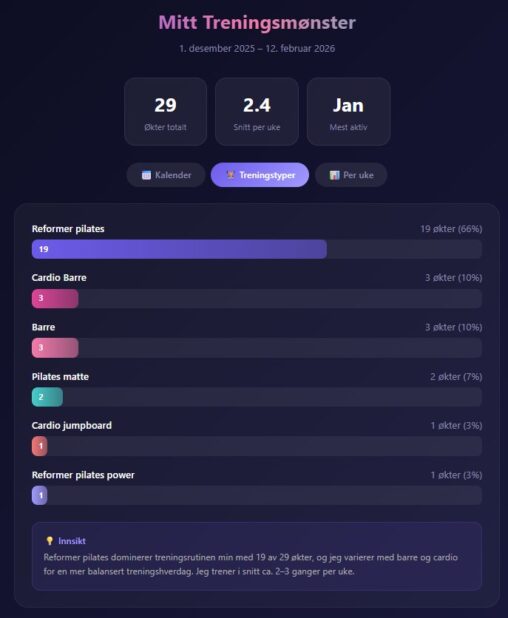
Denne visualiseringen viser mitt personlige treningsmønster over en periode på ca. 12 uker, fra 1. desember 2025 til 12. februar 2026. Dataene er hentet fra min egen treningslogg…
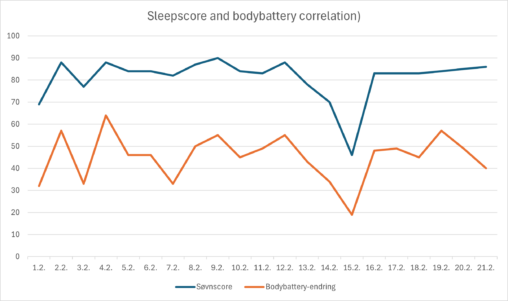
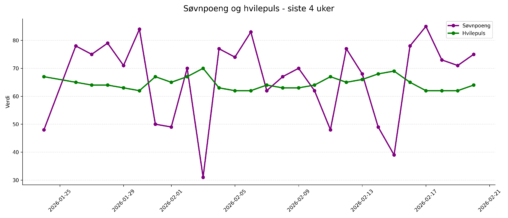
The correlation between sleepscore and bodybatteri in Febrary 2026
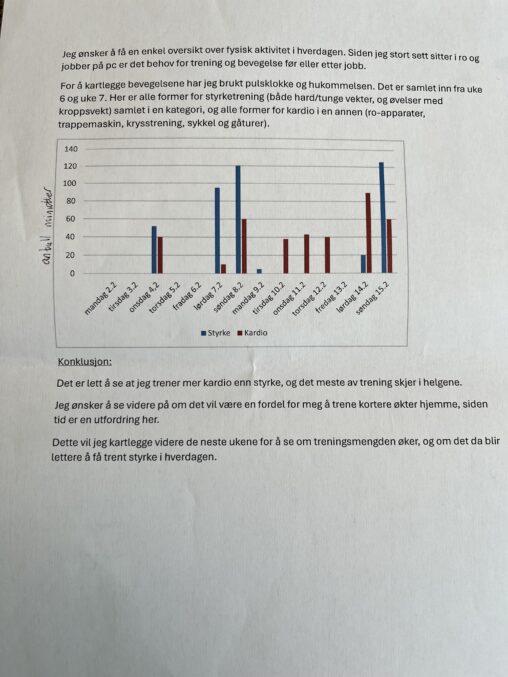
Registrert antall minutter trening av styrke og kardio pr. dag i uke 6 + 7. Brukt hukommelse (de dagene jeg har gått hjem fra jobb siden det er…
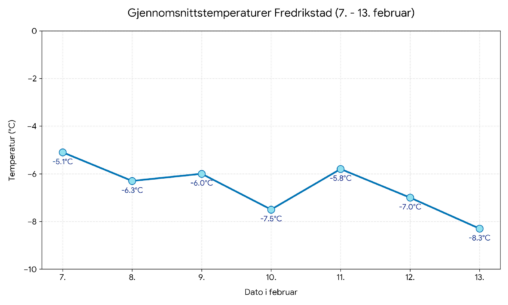
Gjennomsnittstemperatur gjennom uke 7 i Fredrikstad generert av KI med data fra vg.no
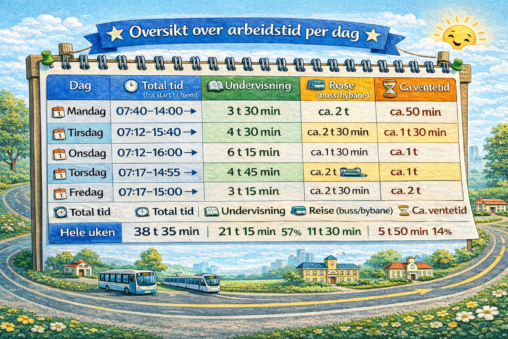
Jeg har en travelt arbeidsuke som består av undervisning, reise med buss og vente på buss. Jeg har prøvd å samle oversikt og se hvor mye tid jeg…
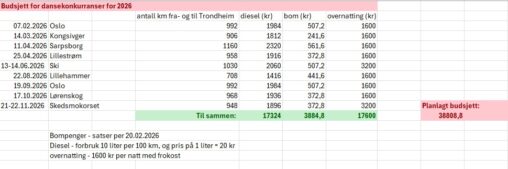
Dette er en budsjett som viser planlagte kostnader til turer til dansekonkurranser i 2026. Tabellen viser antall kilometer mellom Trondheim og dansehallen hvor er dansekonkurranse. I tillegg viser…
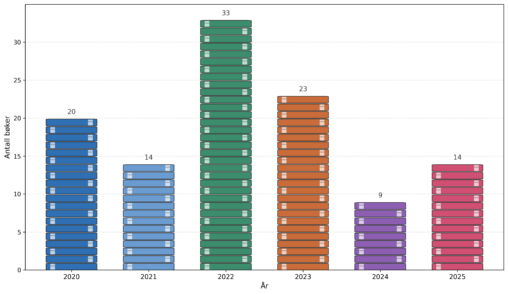
Number of books I have read from 2020 til 2025. Public domain. My own data.
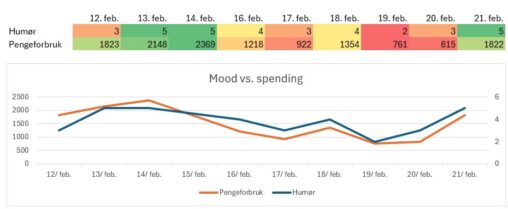
Grafen viser humør angitt i terningkast 1-6 og pengeforbruk angitt i kroner over 10 dager. Resultat: Dataene viser at det kan være en sammenheng mellom humør og pengebruk….
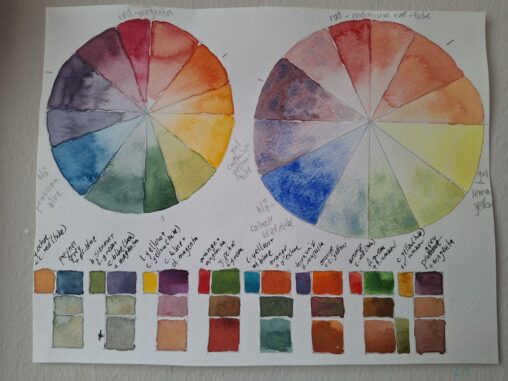
Two colourwheels, showing mixed primary, secondary and tertiary colours, using watercolour paints of different hues, brand and types. Swatches of two already mixed watercolours, so four colours altogether,…
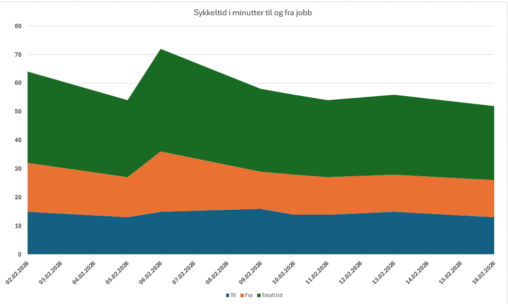
I første halvdel av februar målte jeg hvor lang tid det tok å sykle til og fra jobb. Selv om strekning er den samme hver dag, påvirkes turen…
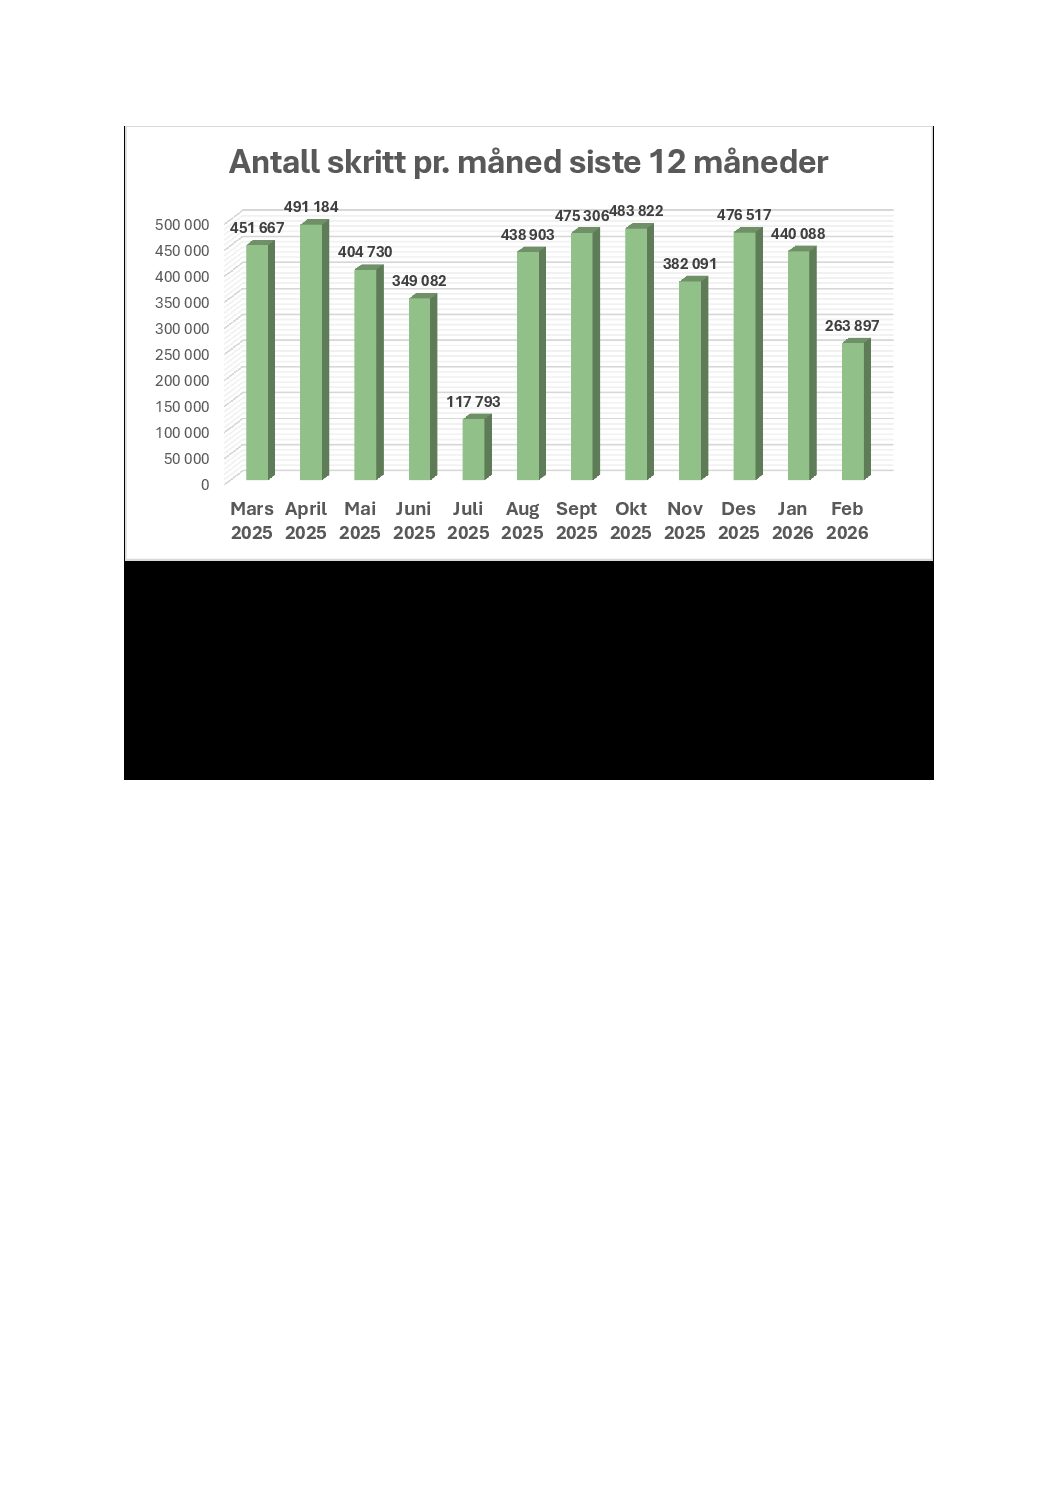
Stolpediagrammet viser en oversikt over antall skritt jeg har gått månedlig de siste 12 månedene. Data er hentet fra min pulsklokke Garmin Vivoactive 5. Jeg overførte data fra…
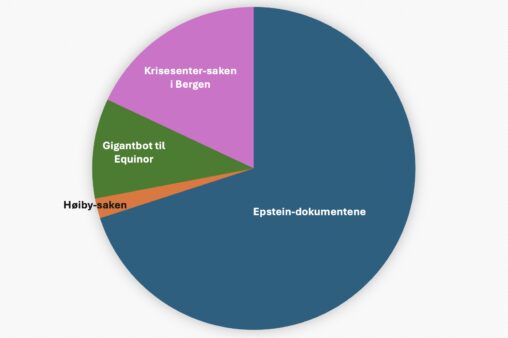
Sektordiagrammet visualiserer hvilke norske nyhetssaker gjorde sterkest inntrykk på meg vinteren 2025–2026.
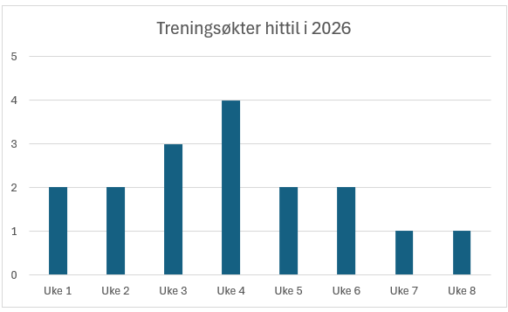
Her vises mine treningsøkter hittil i 2026, basert på aktiviteter som jeg har logget hos SATS. Grafen viser antall økter i uken, må innrømme at trendlinjen ser ganske…
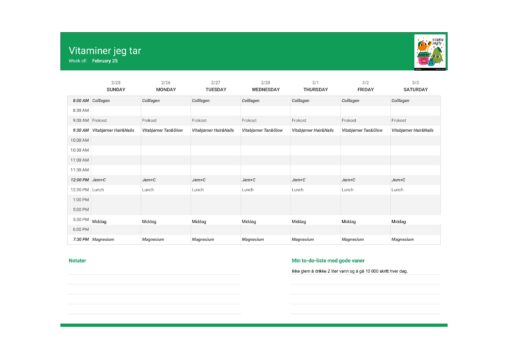
This is a visualization of my weekly health plan based on vitamins I plan to take and habits I want to control. I used regular spreadsheets to make…
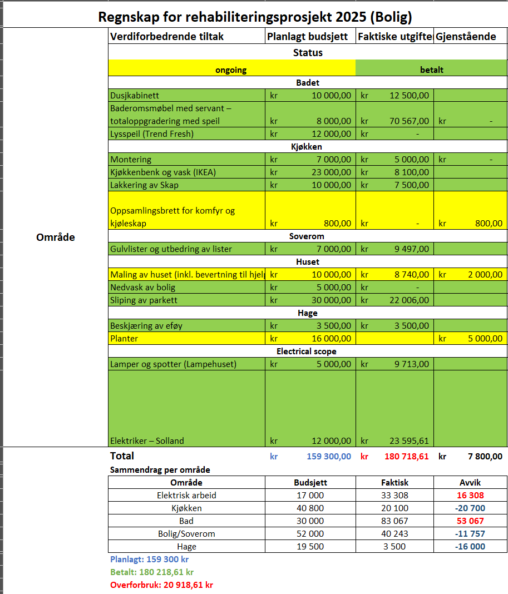
Budget for an apartment upgrading to current standards during 2025 in Norway, all the figures are in Norwegian crowns ( 1$ = 10 NOK)
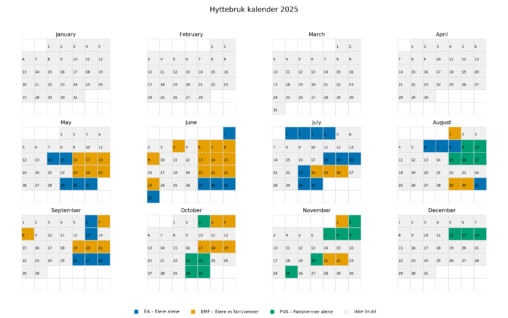
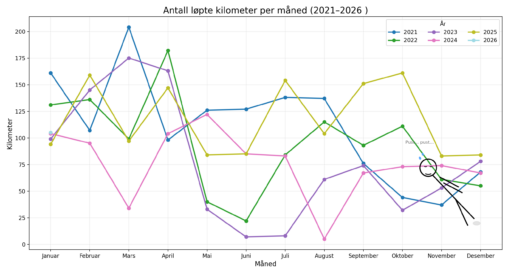
I wanted to find out how much the cabin we bought mid may 2025 was being used all 2025 to check if we got money for value of…
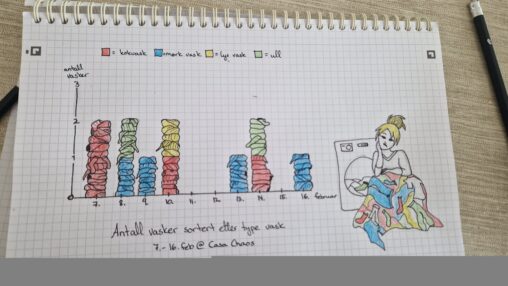
Antall ganger vaskemaskinen ble kjørt i huset vårt i perioden 7.-16. februar 2026, fordelt etter type vask. Håndtegnet.