
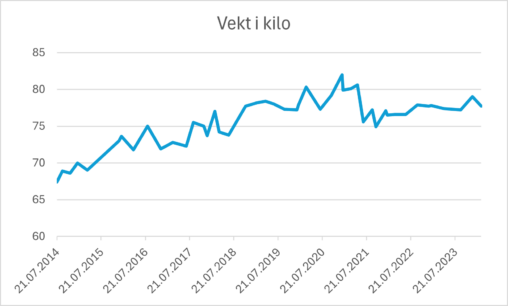
1466 Data visualizations Categorized "30-64" (page 63 of 74)
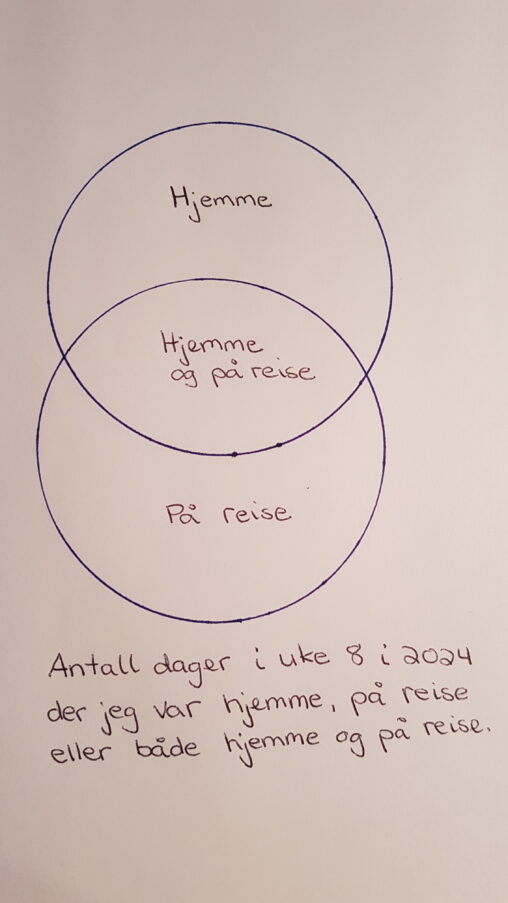
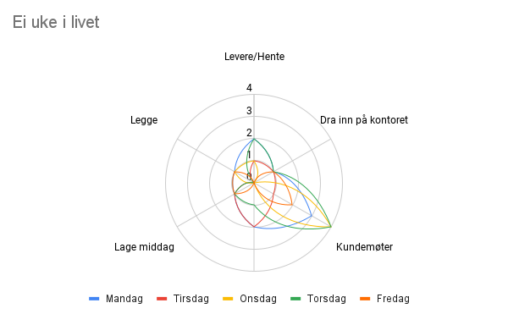
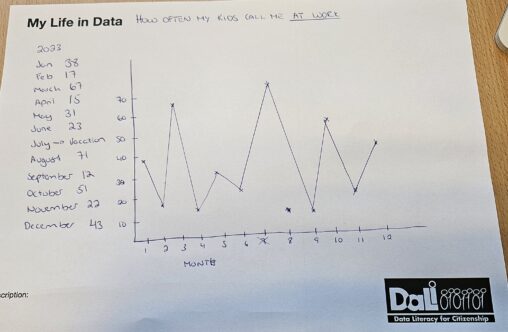
Det er et venndiagram som viser antall dager i løpet av en bestemt uke jeg var hjemme, antall dager jeg var på reise og antall dager der jeg…

Picture shows a rainy day in Bergen. The data in the picture are statistic rain days for Bergen and Lillestrøm in the period 1991 – 2021. (Yes, I…
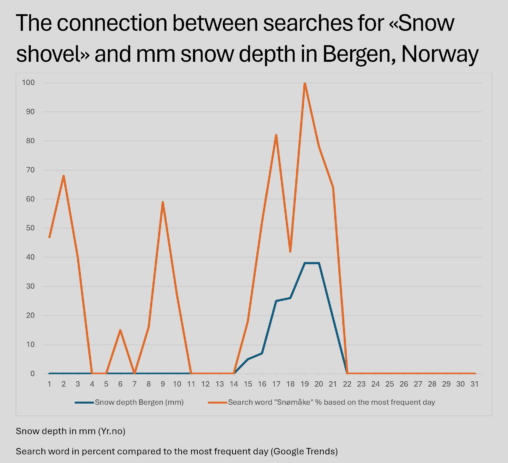
The snow depth is in millimeters for the month of January 2024 and the data is collected from yr.no a norwegian weather service. The search word “Snømåke” is…

The historical electricity prices are gathered from website https://slipper.no/historiske-nordpool-strompriser/. This shows Nordpool’s average electricity prices in øre pr kwh from January 2016 to January 2024.
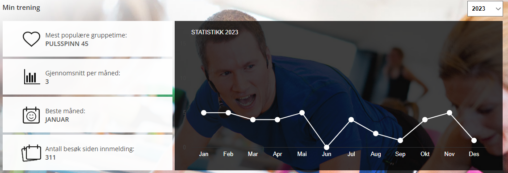
Statistikk samlet inn av mitt valgte treningssenter, som viser hvor ofte jeg trener pr måned, hvilken type trening jeg går på og sikkert også tidspunkt på døgnet.
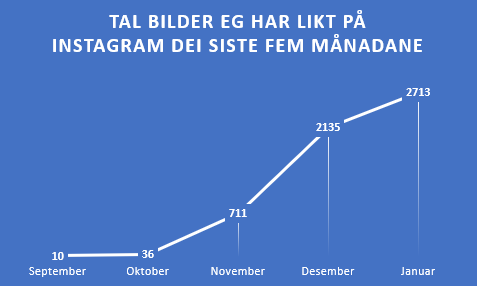
Auken i likeklikk viser eit ønske om å gjere noko under eit pågåande folkemord mot palestinarane. Tala er ikkje heilt riktige, sidan eg i ei periode ikkje fekk…
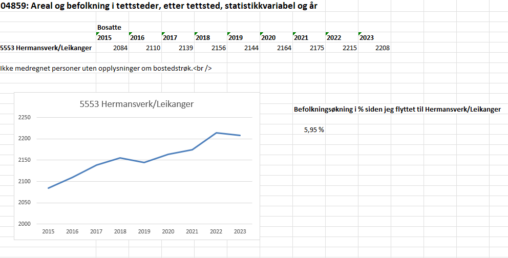
Dette bilder bruker statistikk fra SSB til å vise økningen i befolkningen på Hermansverk/Leikanger i perioden 2015-2024. Prøv selv på

Jeg har foreløpig bare lest to av Rileys bøker, men har fire som venter.
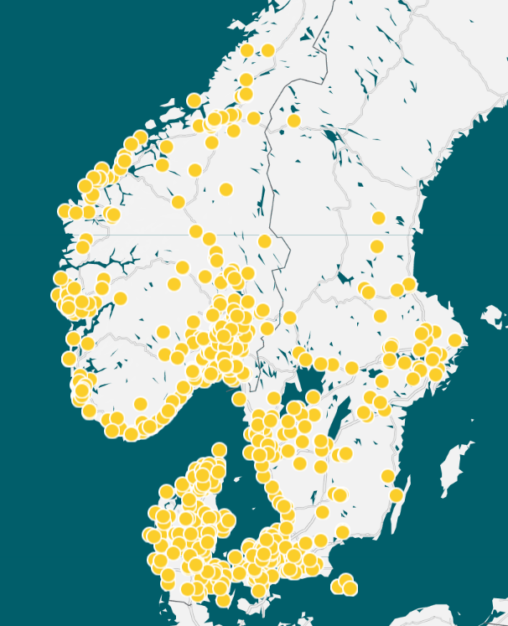
The pic represents locations of vending machines that are sold and placed by an incredible team of people that I had the honor of to lead.
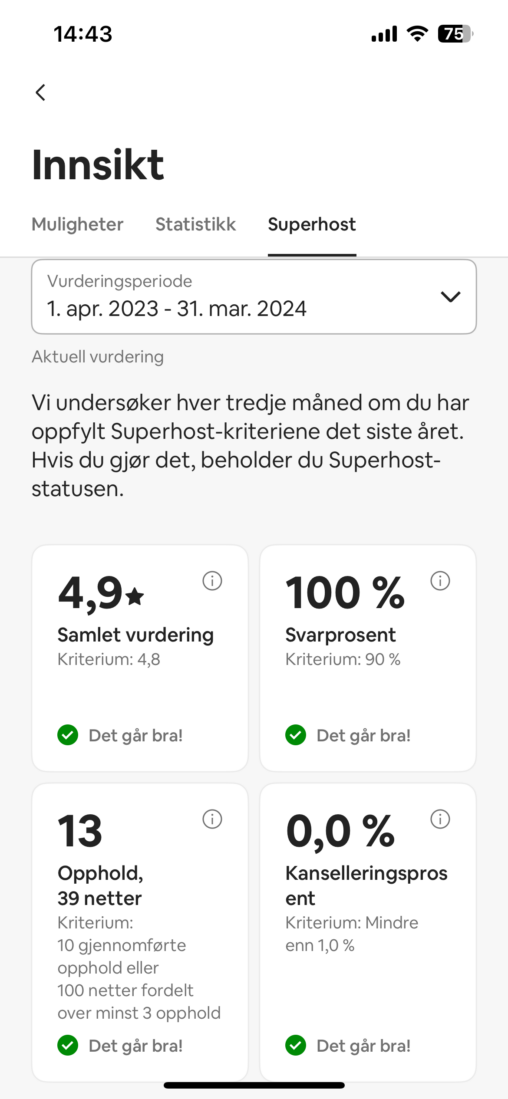
Ved å leie ut hytta blir jeg som utleier ratet av gjester. Får man gjennomsnittlig høy rating på flere ulike faktorer, kvalifiserer det til å bli Super-host. Det…


I 2023 var det 2 339 personer som pendlet ut av Kongsvinger kommune, og 2 997 personer som pendlet inn til Kongsvinger kommune. Bildet er AI generert.
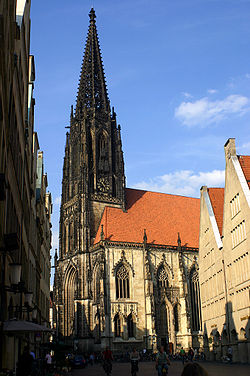
Bildet er fra Prinzipalmarkt i Munster. Munster er en by i den tyske delstaten Nordrhein-Westfalen. Den ligger nord i staten og anses som Westfalens kulturelle sentrum. https://no.wikipedia.org/wiki/Nordrhein-Westfalen https://no.wikipedia.org/wiki/Westf%C3%A4lische_Wilhelms-Universit%C3%A4t
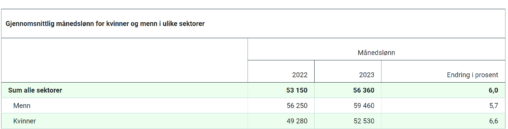
Dataene er hentet fra SSB lønnsstatistikk på ssb.no, og viser gjennomsnittlig månedslønn for kvinner og menn totalt i Norge for årene 2022 og 2023, og endringen i prosent…
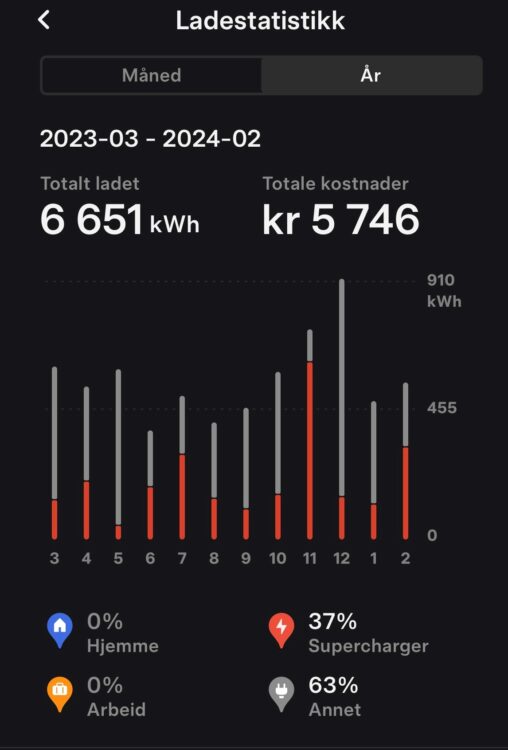
Picture shows my Teslas charging split between supercharging and normal charging.
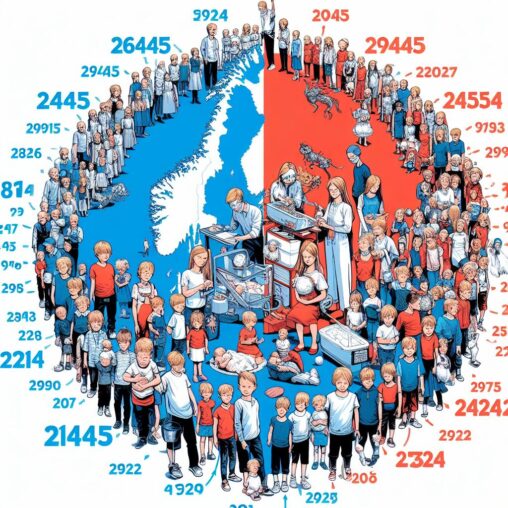
Bildet skal illustrere forskjellen mellom antall gutte- og jentefødsler i Norge i 2022. Gutter: 26 445 Jenter: 25 035