
1466 Data visualizations Categorized "30-64" (page 6 of 74)

Min hverdag: Jeg står opp kl. 06.00, pusser tennene og mater katten. Deretter tar jeg bussen til arbeid. Arbeider mellom 08.00 og 15.30, deretter tar jeg bussen hjem…
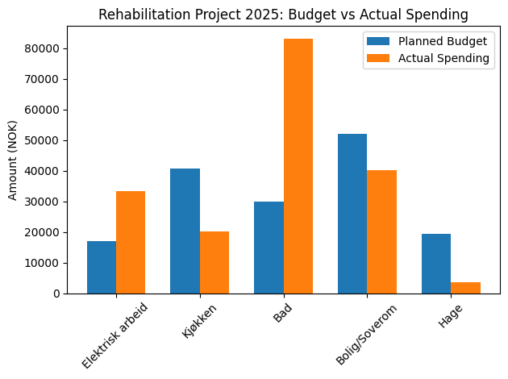
A rehabilitation project in 2025 was planned for my apartment with a fixed budget.The project was divided into five areas: Electrical work Kitchen Bathroom Bedroom/Interior Garden The goal…

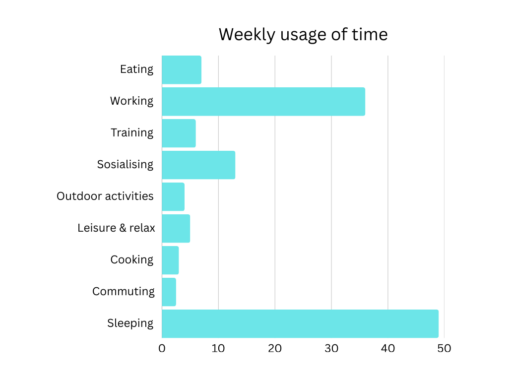
[link url=”https://www.canva.com/design/DAHCEmBUm2Y/q9tI3vXxlZ6gn_qEqbtudw/edit?utm_content=DAHCEmBUm2Y&utm_campaign=designshare&utm_medium=link2&utm_source=sharebutton” text=”Weekly report of time”
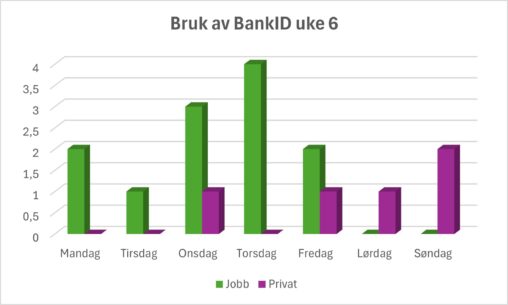
Grafen illustrerer hvor ofte jeg har brukt BankID for å utføre oppgaver i uke 6 i år. Oppgavene er skilt på private gjøremål og jobbrelaterte aktiviteter.
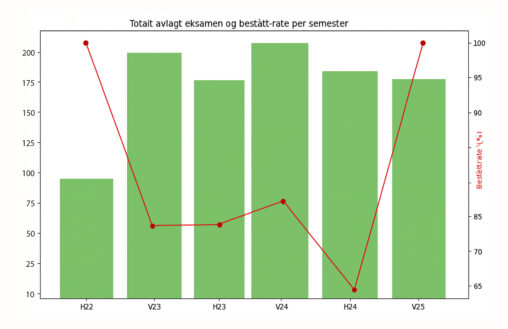
Visualisering av hvor mange som fullførte emnet ‘DIGI110 Fantastiske data’ ved Universitetet i Bergen fra og med høsten 2022 til og med våren 2025, og hvor stor andel…
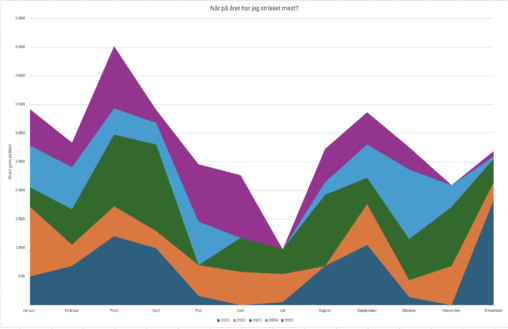
Har samlet data over ferdigstilte strikkeprosjekter i løpet av de siste 5 årene og ville se på om det var perioder i året jeg har strikket mer enn…
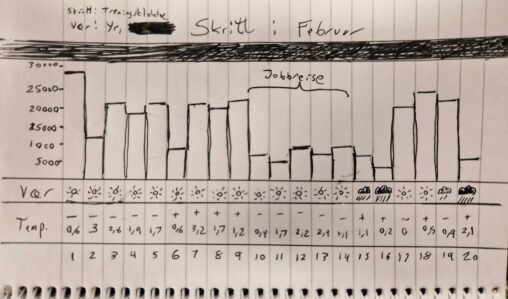
The chart shows my average daily steps in the time period February 1st to 20th, 2026. This is juxtaposed with the average temperature for the given day, as…
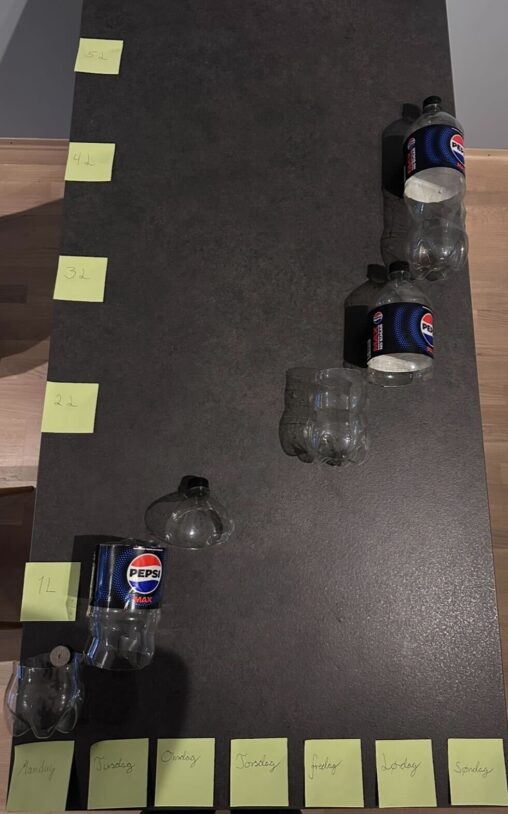
This is an visualisation of Pepsi Max consumption for a week in february 2026. The x-axis shows time (in days), while the y-axis shows consumption (in liters). The…
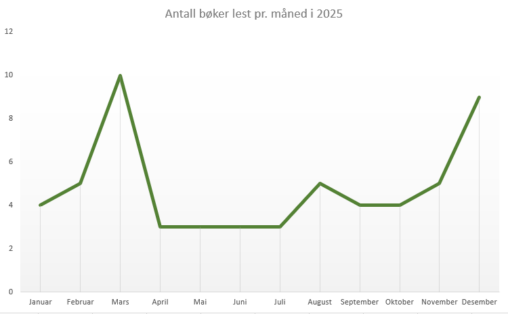
Diagrammet viser antall bøker jeg har lest per måned i 2025. Data er hentet fra min personlige profil hos Goodreads.
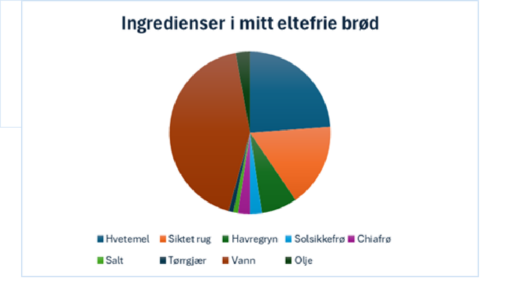
Visualisering av mengdeforhold mellom ingrediensene i brødene jeg baker
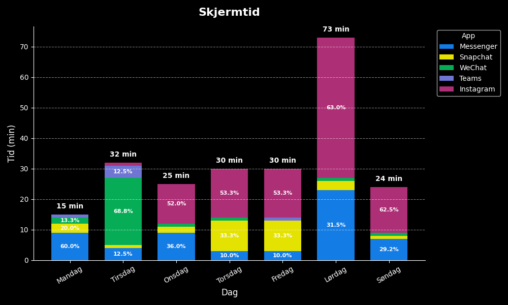
Diagrammet viser data over skjermtid på mobil for ulike apper i løpet av en uke. Tidene er hentet fra mobilen for de respektive dagene og registrert i et…
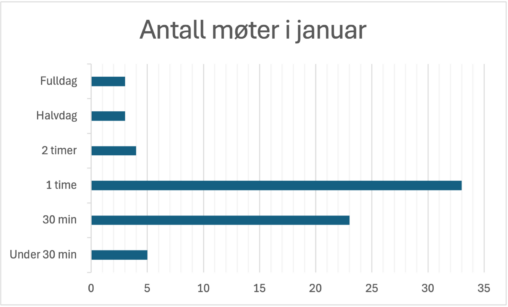
Oversikt over alle møter på jobb i janaur 2026. Data er hentet fra min personlige kalender i Outlook.
Ingredienser til 2 brød
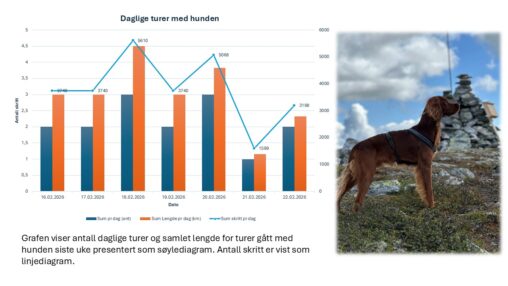
Har samlet data i uke 8 (16-22 februar) på følgende: – antall turer jeg har gjennomført med min hund – antall skritt jeg har gjennomført med min hund…
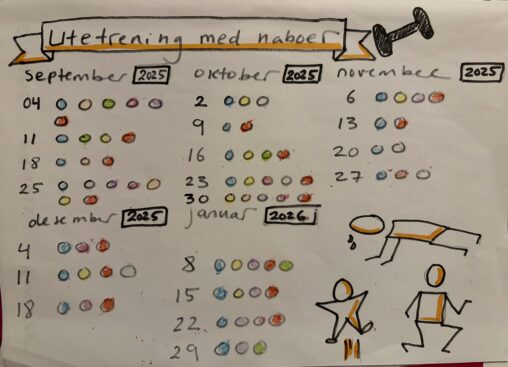
The drawing visualizes the dates for training outdoors with my neighbors in the period September 2025 to January 2026. I started with my Strava app to see when…
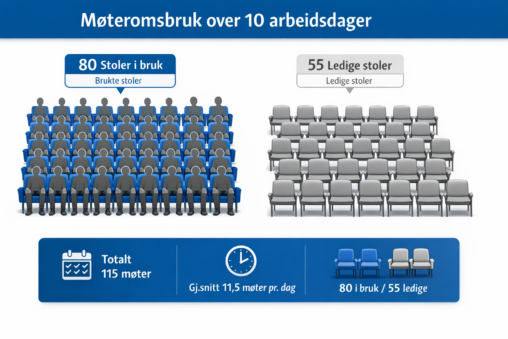
Kartlegging av bruk av møterom på min arbeidsplass. Telling over periode på 10 dager. Data er generert fra excel med bruk av Copilot M365 til å lage illustrasjon.
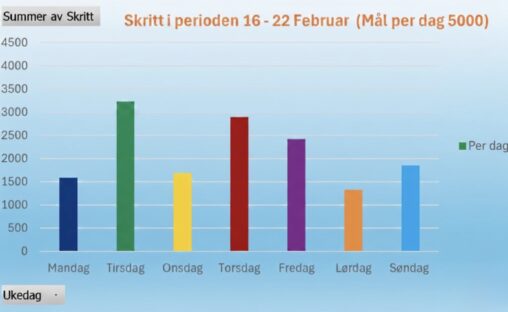
Data er lagret i Excel med søyler som viser oppnådde skritt per ukedag sist uke –