
1466 Data visualizations Categorized "30-64" (page 56 of 74)

Sammenligning av antall personer innenfor spesifikke aldersgrupper, fra 19-90 år +, i bydel Nordstrand og Oslo under ett. Data er hentet ut i fra bydelsfakta, Oslo statistikken, publisert…
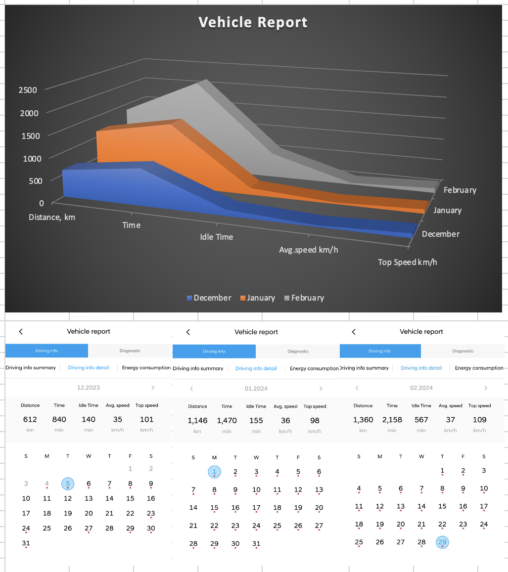
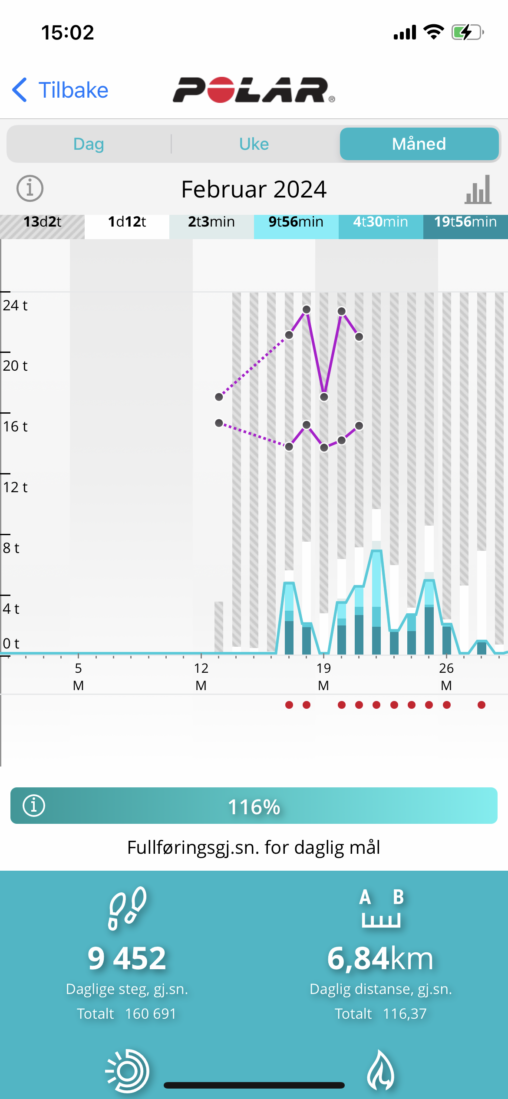
I have used a data from my car App to see how many km and time I have been using my electric car while driving to work everyday….


Oversikten viser antall kommuner og fylker i tre ulike årstall. Ønsker å få vist fram at antall kommuner og fylker har gått ned.
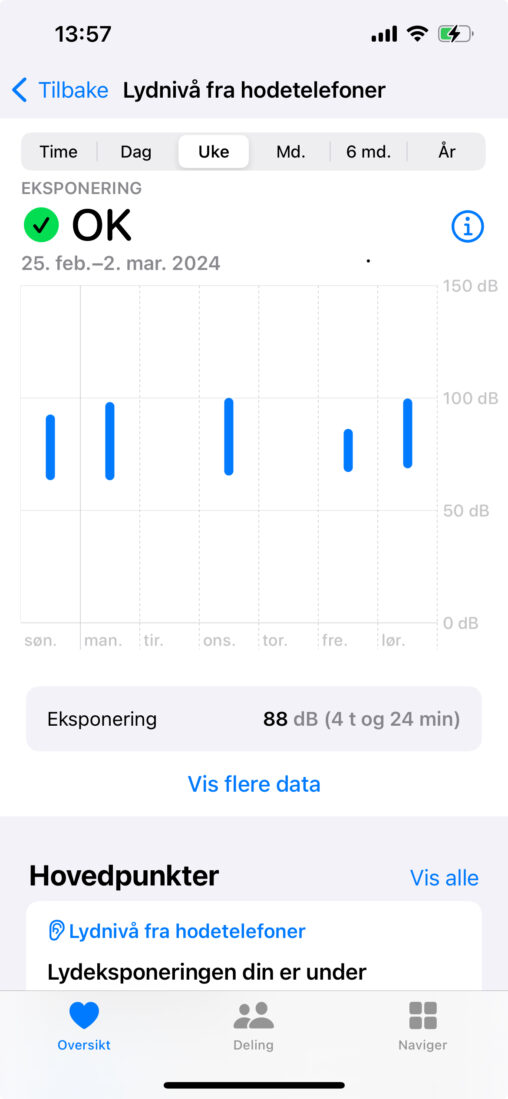
Viser eksponering av lys i hodetelefoner uken 25. feb – 2.mars
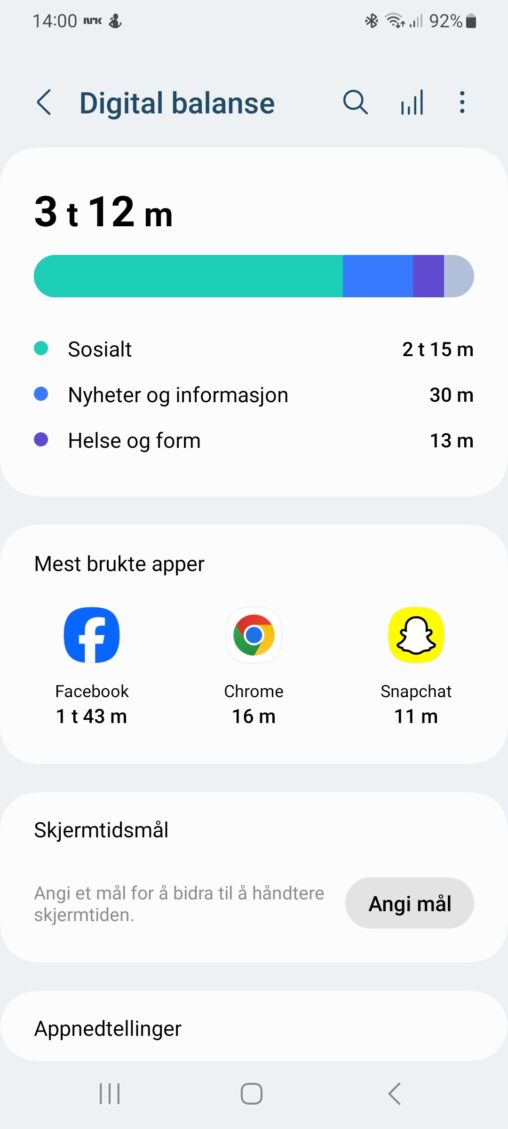
Her presenteres oversikt på hvor mye jeg bruker. Gir et innblikk i apper og bruk.
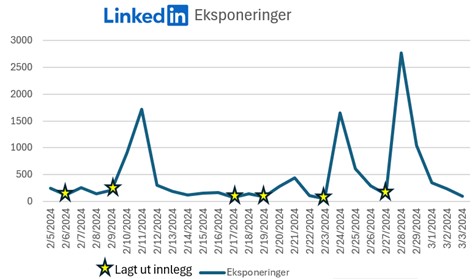
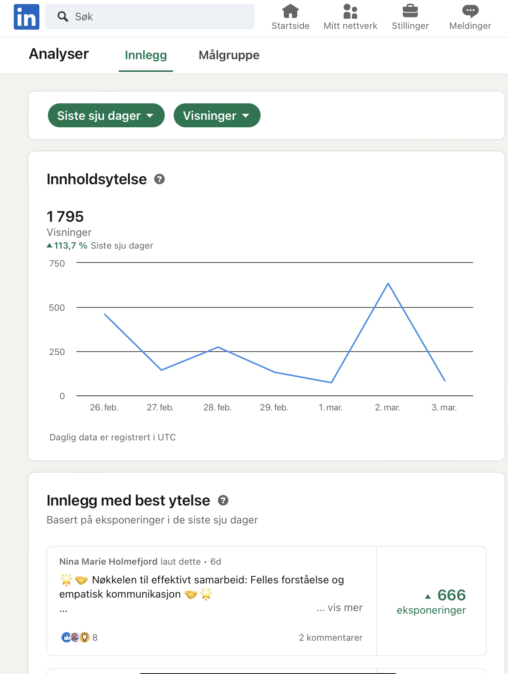
Jeg ønsket å analysere dama fra egen aktivitet på LinkedIn profil (Nina Hanssen) de siste 28 dagene. I grafen vedlagt la jeg inn antall eksponeringer gjennom perioden og…
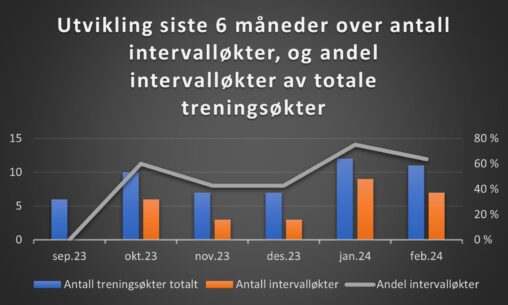
Grafen viser både antall totale løpeøkter og antall intervalløkter i perioden september 2023 – februar 2024, samt hvor mange prosenter av de totale løpeøktene som er intervalløkter.
Dataene viser antall skritt gått i følge telefonen hver søndag hittil i 2024 totalt 8 søndager.
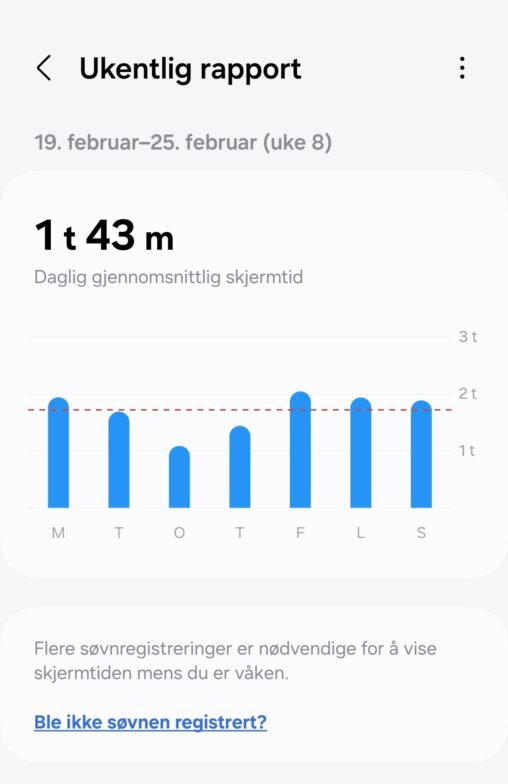
Viser en oversikt over daglig gjennomsnittlig mobilbruk. Gjennomsnittet er 1 time og 43 minutter i uke 8. 4 av 7 dager er over denne grense.

The image shows a graph with sleep scores for 26 Feb – 3 Mar, as measured by a Garmin wrist watch. The score scale is 0-100 and the…
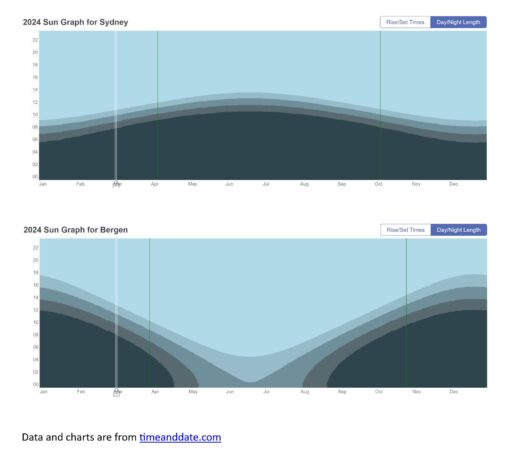
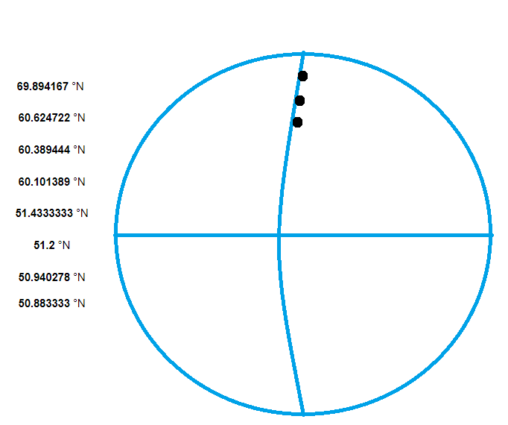
Annual distribution of daylight hours (described as night, twilight and daylight) for Sydney (Australia) and Bergen (Norway).
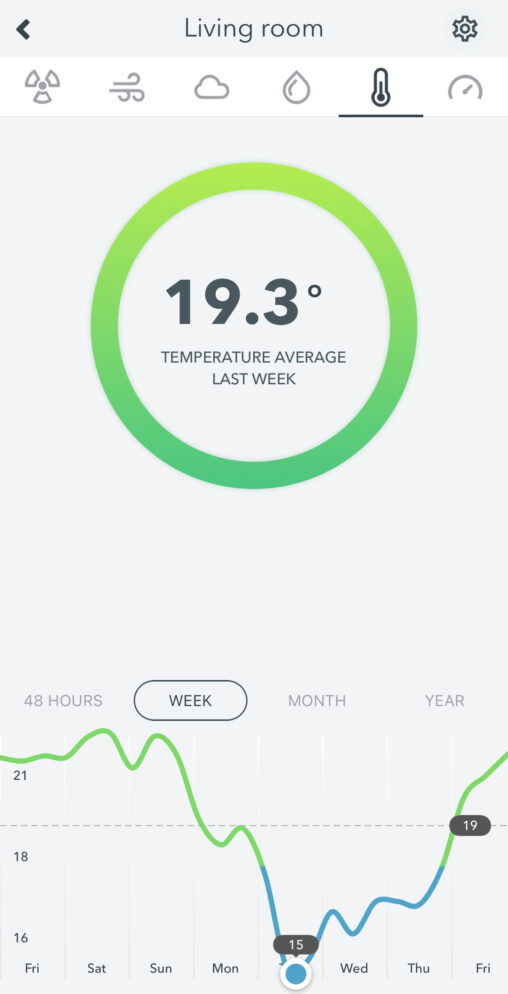
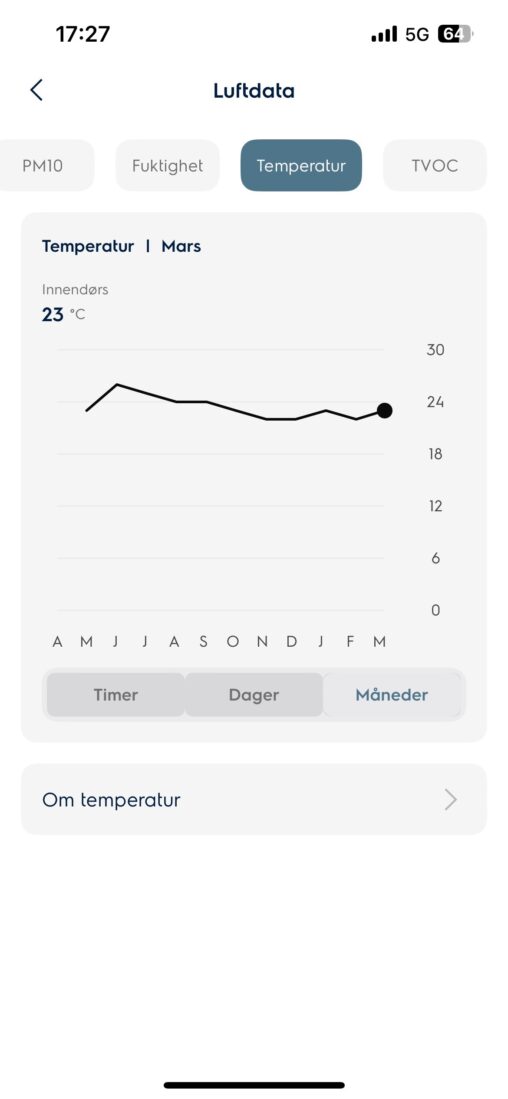
Temperaturkurve for inneklima i en leilighet med utskifting av vinduer i uke 9 i en leilighet i Bergen by. Bildet illustrerer både gjennomsnittstemperatur for uken og per dag.
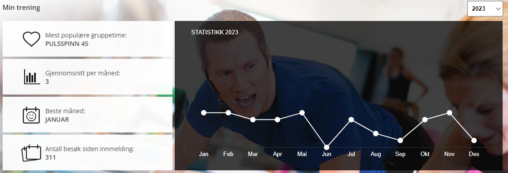
Mine treningsdata for 2023, hvor ofte jeg var på trening, hvilke gruppetimer jeg var på.