
1466 Data visualizations Categorized "30-64" (page 53 of 74)

Book covers as represented in Kindle’s mobile app for Iphone. Indication of newest books opened and read from my collection.
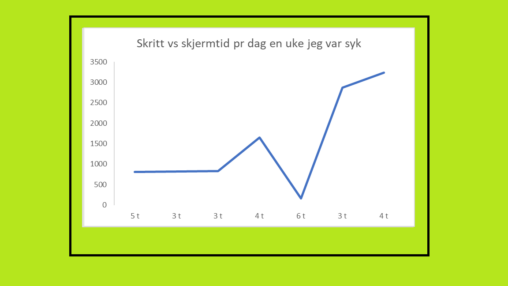
Graph showing steps per day vs screen time per day during a week of illness..

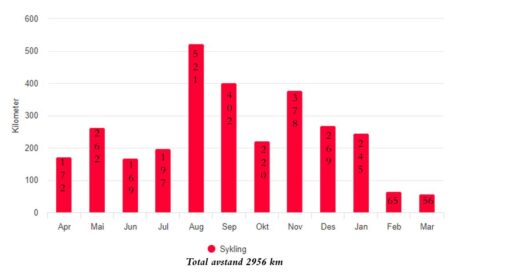
Brukte kalender, samt treningslogg via Strava app. Strava er eier av app som samler data.
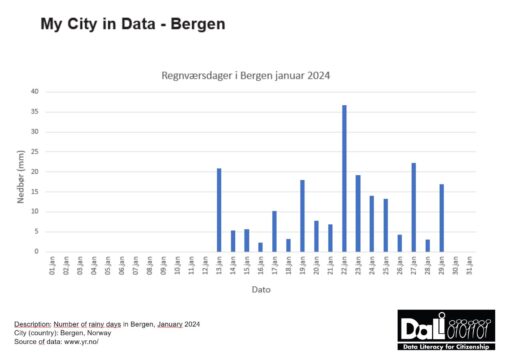
Nedbør (mm) pr dag i Bergen januar 2024. Opphavsrett © NRK og Meteorologisk institutt 2007–2024.
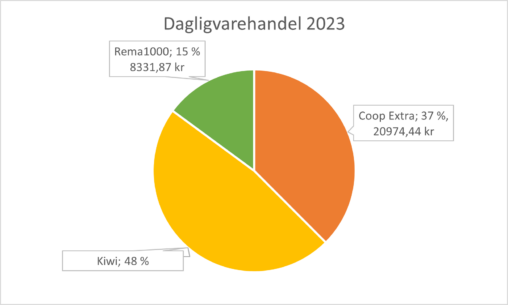
Mine innkjøp i 2023 hos Coop Ekstra, Kiwi og Rema 1000

I am representing the time I have spent learning, teaching, correcting, calcualting, helping others with and made videoes about mathematics in week 37 in 2023.

Soltimer i Bergen de siste 5 årene fordelt per måned. Dataene er hentet fra Norsk klima service senter.

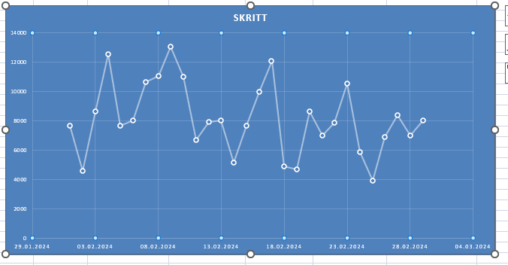
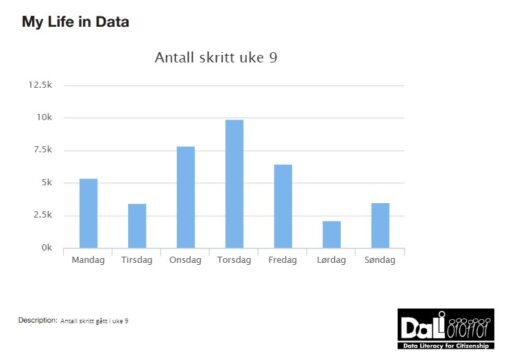
My monthly steps. I am the owner of the data. Data is captured from my Garmin watch.

Kilde: Arbeidskraftundersøkelsen, Statistisk Sentralbyrå
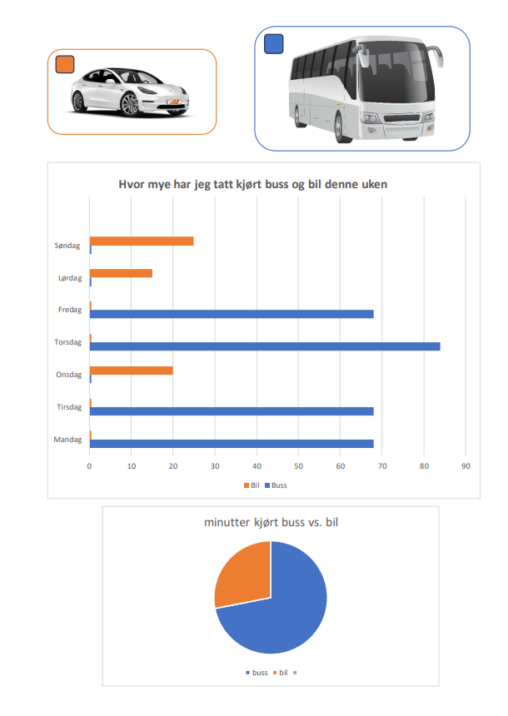
Hvor mye jeg har kjørt buss og bil i løpet av en uke. Dataen er samlet fra 26.02.24 – 02.03.24
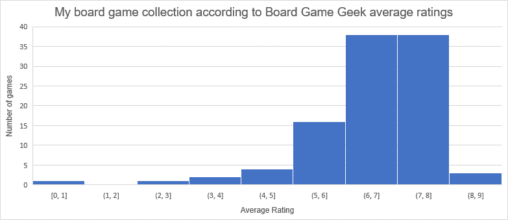
BoardGameGeek (BGG) is an online forum and database holding information, pictures, reviews, and discussions for more than one hundred thousand games. BGG allows users to rate board games…
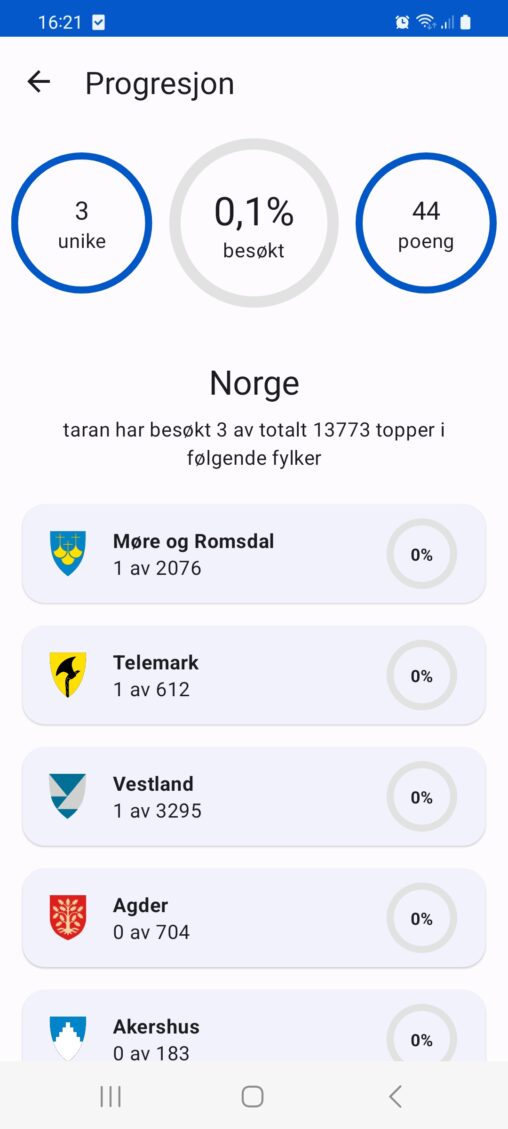
Data viser de tre av totalt 13773 fjelltoppene som har blitt registrert og prosentandelen dette utgjør. Hentet fra appen «Fjelltoppjakten»
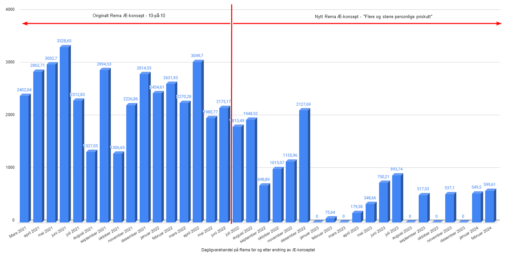
I juni 2022 endret Rema Æ-konseptet sitt, slik at man ikke lenger fikk 10% rabatt på de varene man brukte mest penger på. Dette var en ordning der…

Forskjellen på mm nedbør siste 30 døgn målt mellom Førde og Kongsvinger.
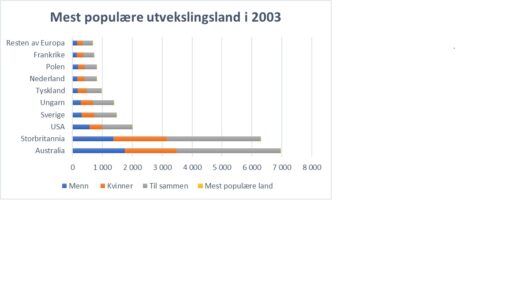
A table over the 10 most popular countries for norwegian exchange students in 2003