1466 Data visualizations Categorized "30-64" (page 52 of 74)
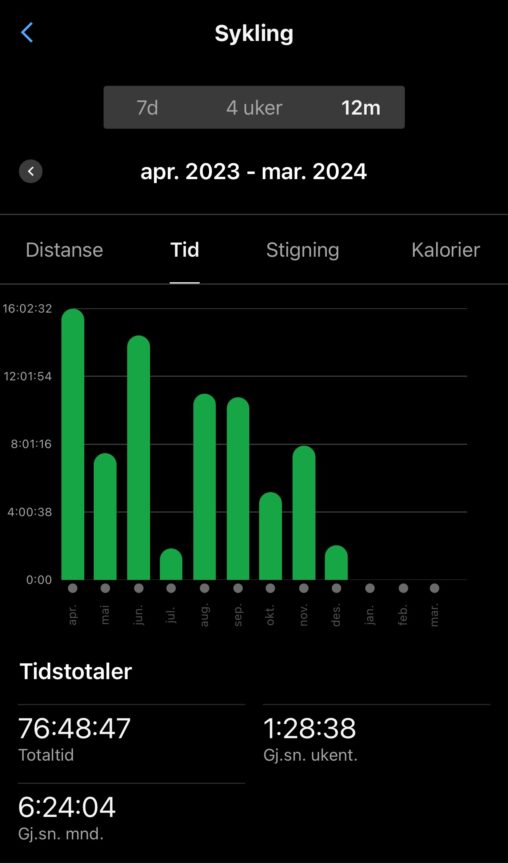
Visning av hvor mye tid jeg har brukt på mine registrerte sykkeløkter siste 12 mnd

This is data from my iPhone. Made me wonder if there is a connection between how many interruptions (notification) in context to weekly use. I will need to…

I collected weatherdata from my smart weatherstation for the last three months. The data is exessive but shows temp, humidity, co2 and noise pressure. When i set it…

Med utgangspunkt i 5 forskjellige aktiviteter viser grafen deltakelse av seniorer i et tidsrom på rundt et halvt år. Dataene er basert på frammøteregistrering i et aktivitetslokale, dataene…
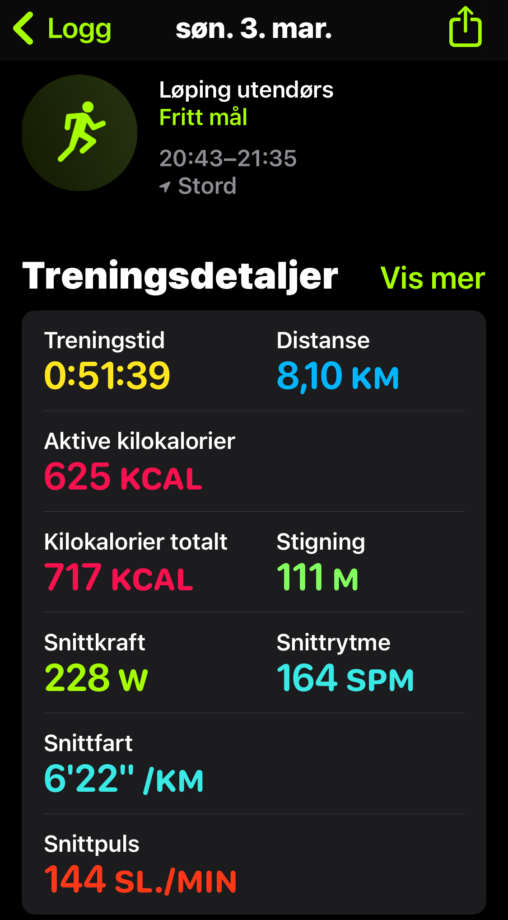
Dette er ein skjermdump frå mosjonsappen “Mosjon” knytta til Apple si smartklokke av typen iwatch.

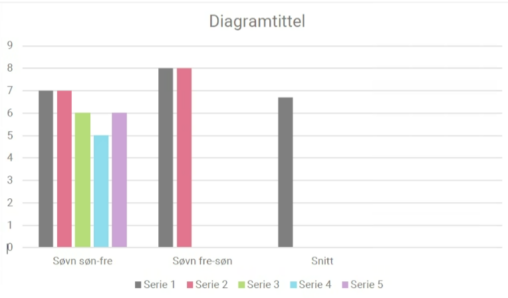
Diagrammet viser søvn søndag til fredag og fredag til søndag. Samt snitt.
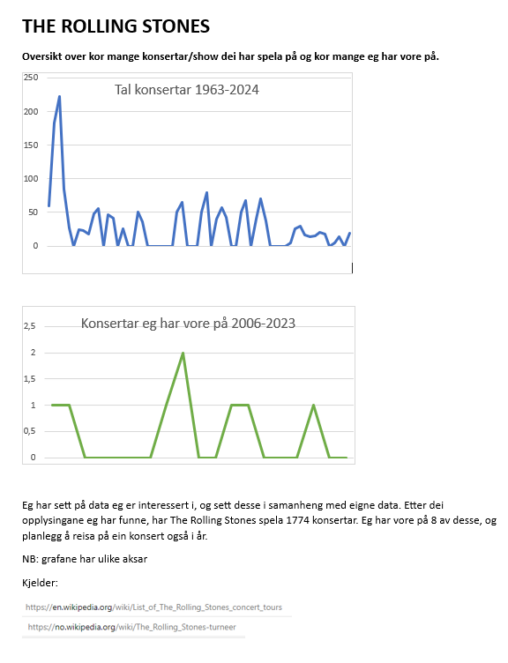
Eg har sett på data eg er interessert i, og sett desse i samanheng med eigne data. Etter dei opplysingane eg har funne, har The Rolling Stones spela…

En dag i mitt treningsliv – i data. Her har jeg vært på fotballtrening.
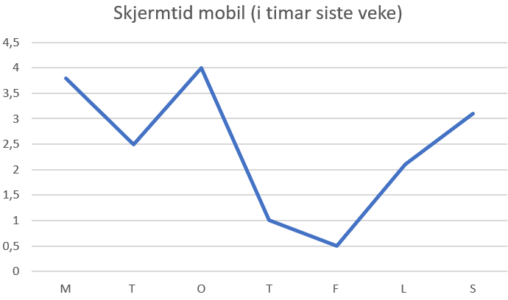
Tal på timar pr. dag brukt på mobil, frå måndag til søndag, basert på mobiltelefonens rapport.
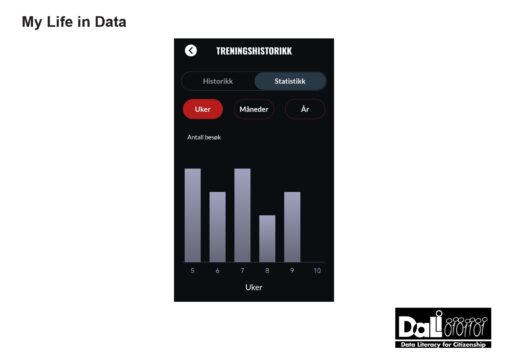
Antall treningsøkter pr uke vist som søylediagram fra appen som tilhører treningssenteret. Treningssenteret lagrer treningshistorikken og sletter denne automatisk slik at det bare er data fra de siste…
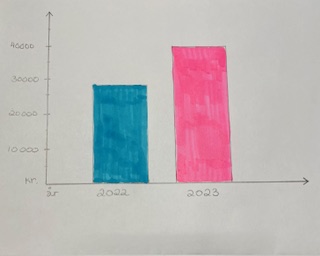
Grafen viser hvor mye min samboer og jeg har brukt på dagligvarer i året før barn i 2022 og etter vårt første barn som ble født januar 2023….
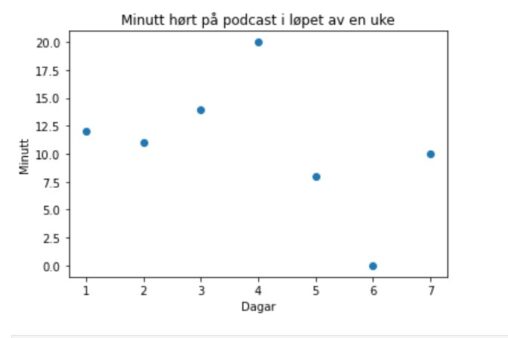
Scatter plot som viser hvor mange minutt jeg lyttet til podcast forrige uke.
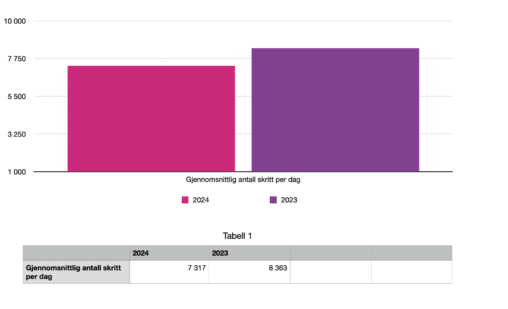
Diagrammet viser gjennomsnittlig antall skritt jeg har tatt per dag hittil i år versus i fjor. Dataene er samlet inn av min Apple Watch og hentet ut fra…
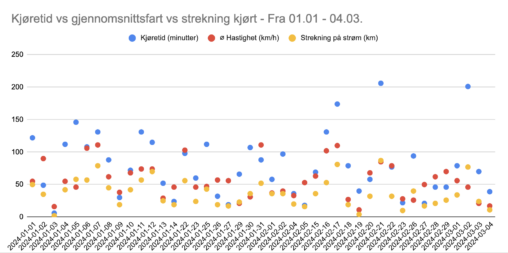
This graph intricately maps out the dynamic interplay between three pivotal dimensions of vehicular movement: the average speed at which a vehicle traverses, the total time spent in…

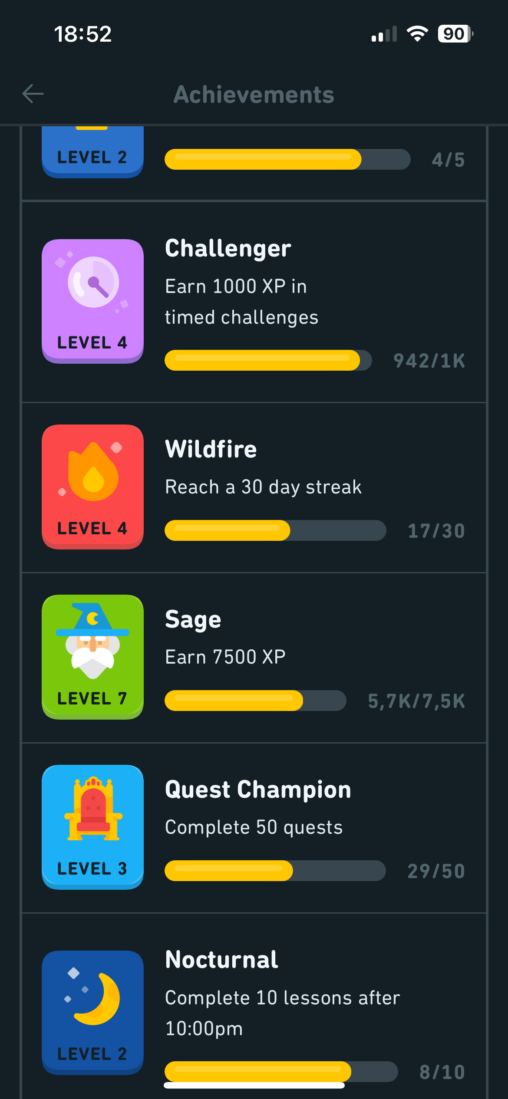
These are virtual achievements earned in the online game World of Warcraft, that I have been playing for some years. This snapshot is from one of my characters…

The things represented in this picture are items from every member of my family. The owner of the data is myself, chose to be anonymous.