1466 Data visualizations Categorized "30-64" (page 51 of 74)
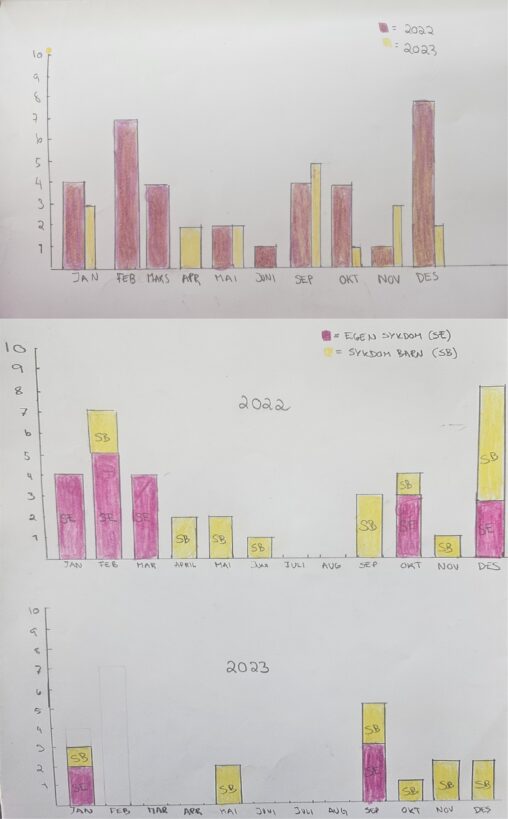
Living with young children – two years of sick days compared
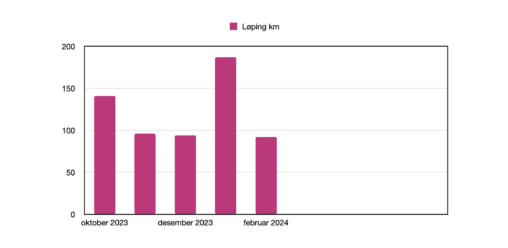
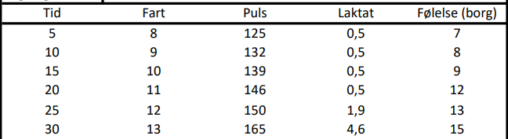
Har hentet ut data fra klokken min og laget en tabell med løpedata og laget et søylediagram av dataen.
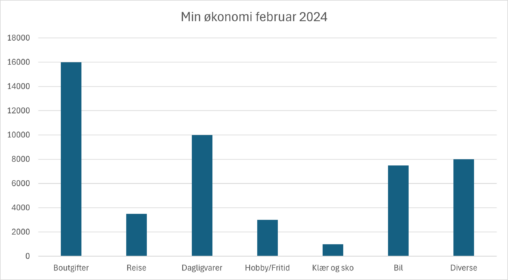
Har hentet ut data fra min nettbank, og satt inn i et stolpediagram i Excel. Alle beløpene er rundet av til nærmeste hele 500 kr.
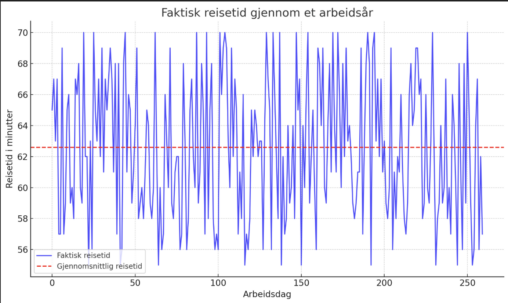
Reisetiden gjennom et arbeidsår, med totalt 260 arbeidsdager. Hver blå linje representerer reisetiden for en enkelt dag, inkludert tiden det tar å levere på skolen og eventuelle forsinkelser….
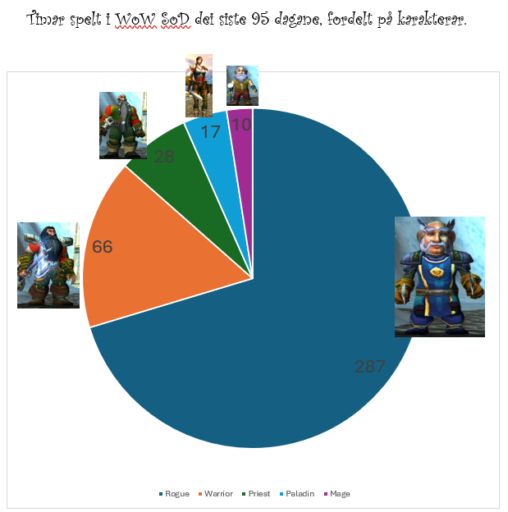
Dette er ein representasjon av kor mange timar som er blitt spelt i spelet World of Warcraft: Season of Discovery ved hjelp av eit kakediagram. Kakediagrammet fordelar timar…

Min mangel på gode idear til datavisualisering når eg kom på oppgåva rett før fristen.

Based on listening statistics from my personal podcast addict app. The link to the source data cannot be shared in this format. I have used MS copilot to…


The graph shows a comparison of the playlists with the music I liked best in the years 2019-2022. As expected, the year 2020 was characterized by more acoustic…
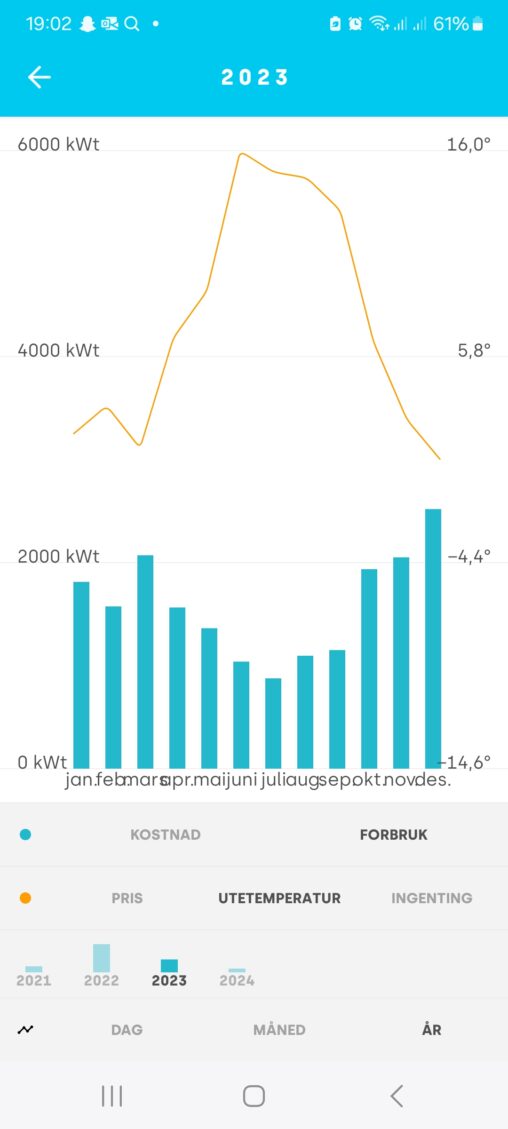
Data er hentet fra min strømleverandør, Tibber som viser hvordan mitt strømforbruk svinger med utetemperatur for året 2023.
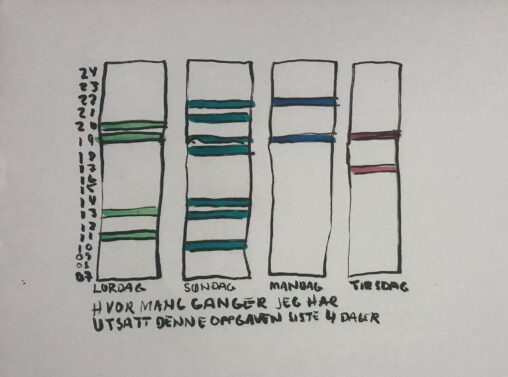
Tabell over siste 4 dagers prokrastinering av eksamensoppgave. Privat tegning.
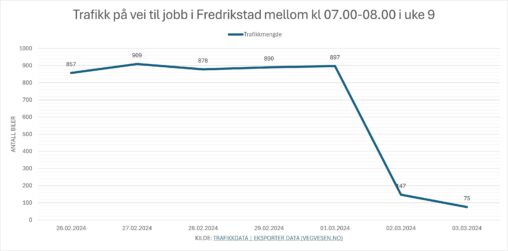
Bilde viser en graf over antall biler mellom klokken 07.00-08.00 på vei til jobben i uke 9. Dataene brukt er hentet fra Vegvesenet sin tellestasjon ST HANSFJELLET og…


Grafen fra SSB viser antall studenter på de ulike utdanningsinstitusjoner var fordelt i 2022.
Grafen viser sammenheng mellom hvor mange minutter utført trening med minutter dyp søvn pr uke. Tallene er hentet fra min Garmin terningsklokke, og jeg har hentet ut data…
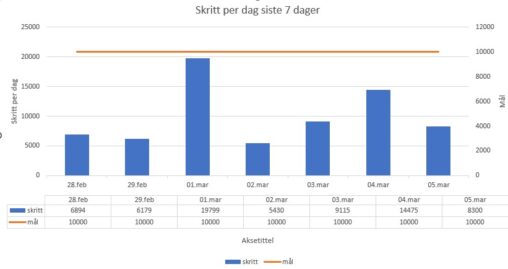
Skritt per dag siste 7 dager. Data hentet fra treningsapp. Illustrasjon laget i Exel.
Beskrivelse av hvor mange nyrer jeg har