
1465 Data visualizations Categorized "30-64" (page 47 of 74)
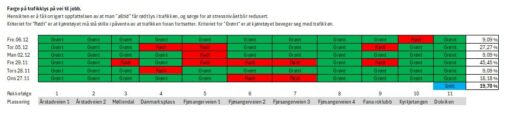
Farge på trafikklys på vei til jobb. Hensikten er å få korrigert oppfattelsen av at man “alltid” får rødt lys i trafikken, og sørge for at stressnivået blir…
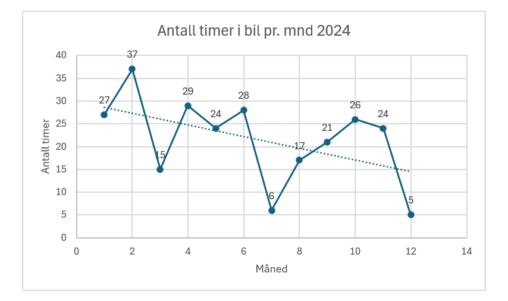
Bildet viser antall timer brukt i bil pr. mnd for 2024. Dataene er hentet fra appen til bilen: My BMW
ChatGPT has taken many professions by a storm in the past year, and mine is no exception. While I mostly use my work account due to data privacy…
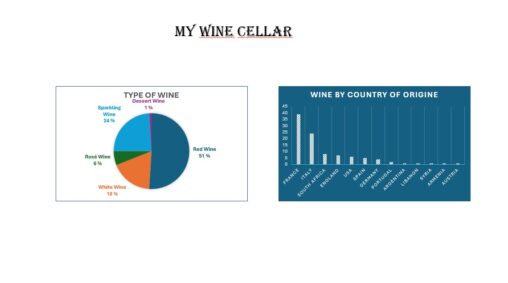
I am collecting wine, and the graphs show data from my cellar. First, it shows the % of different types of wine (red, white, rosé, sparkling, and dessert…
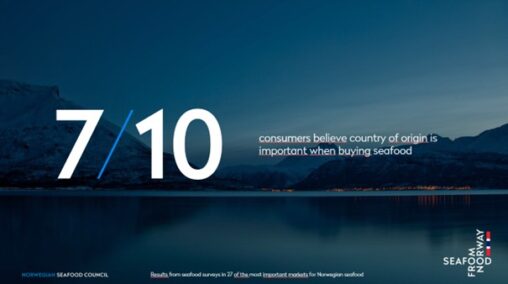
Undersøkelser fra de 27 viktigste markeder for norsk sjømat. Kilde: Norges Sjømatråd.
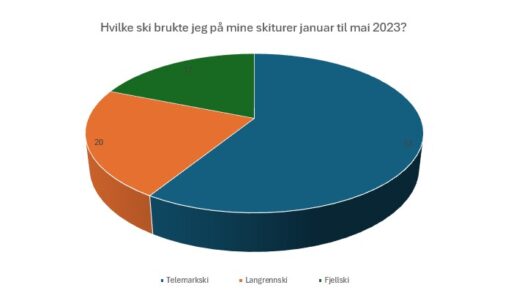
Jeg gikk mye på ski i perioden januar til mai 2023 og her er en oversikt over hvilke type ski jeg benyttet. Totalt var jeg på 90 skiturer…
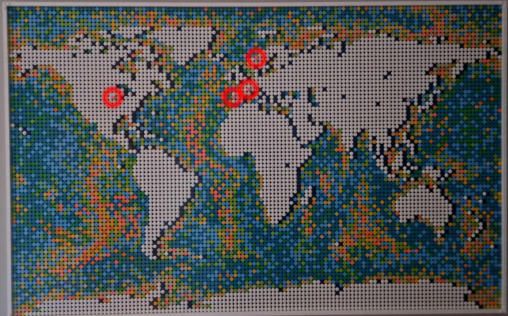
I built a Lego world map over the past year. It took me approximately 16 hours to finish. I have highlighted all the countries where I have lived…

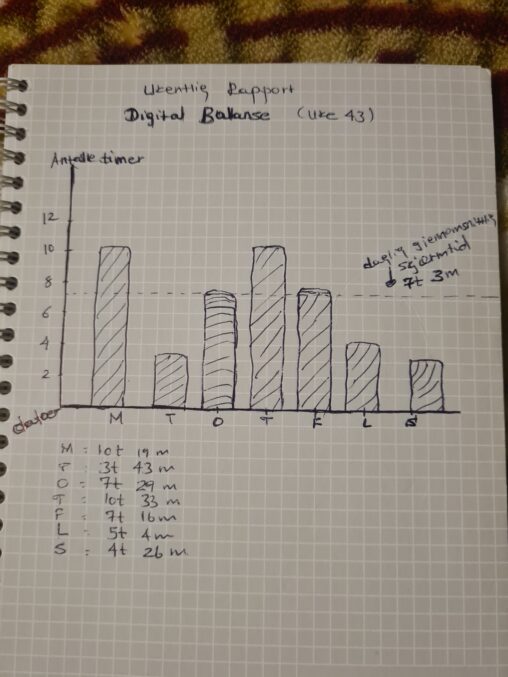
Her viser hvor mye skjermtid har jeg brukt hver enkelte dager i uke 43, og gjennomsnittlig skjærmtiden jeg har brukt.
Her viser hvor mye skjermtid har jeg brukt hver enkelte dager i uke 43, og gjennomsnittlig skjærmtiden jeg har brukt.

Over 8 arbeidsdager ble antall kvinner og menn rundt lunsjbordet notert ned sammen med resultatet av BT quizen. I den grafiske fremstillingen viser x-aksen antall rette svar på…

To diagrammer, der det første vi viser antall pensumsopper til soppeksamen jeg har funnet (108) og hvor mange jeg ikke har funnet (45). Det andre diagrammet viser i…

Data fra 3 Arla kamera oppstilt på hytta ved Geilo.

Data fra våre tre private Arla kamera oppstilt på hytta ved Geilo. Bilder har rekkevidde innen vår eiendom.Data eies av meg selv.

A trout fish in local freshwater outside of Bergen was examined for internal parasites.The trout was found to have approximately 60 capsules of the parasites inside. Dibothriocephalus ditremus…

Over 8 arbeidsdager ble antall kvinner og menn rundt lunsjbordet notert ned sammen med resultatet av BT quizen. I den grafiske fremstillingen viser x-aksen antall rette svar på…

Antal kopper/enheter av ulik type drikke som er inntatt i løpet av en uke. =”https://wearedata.dalicitizens.eu/city-data/” text=”veskeinntak i lopet av en uke”]


Numbers and genres of unique episodes/movies watched on Netflix by myself since November 2023. Based on Netflix statistics for my user account.

En ørret fisket i Spåkevannet ble dissikert og undersøkt for parasitter. Fisken inneholdt cirka 60 fiskeandmakk kapsler av arten Dibothriocephalus ditremus på og rundt magesekken. Kapslene er 6-8…