
1477 Data visualizations Categorized "30-64" (page 26 of 74)
Data i oversikten er hentet fra min treningsapp på SPREK treningssenter. Figuren viser en oversikt over type trening jeg har gjennomført på treningssenter de siste 4 månedene.
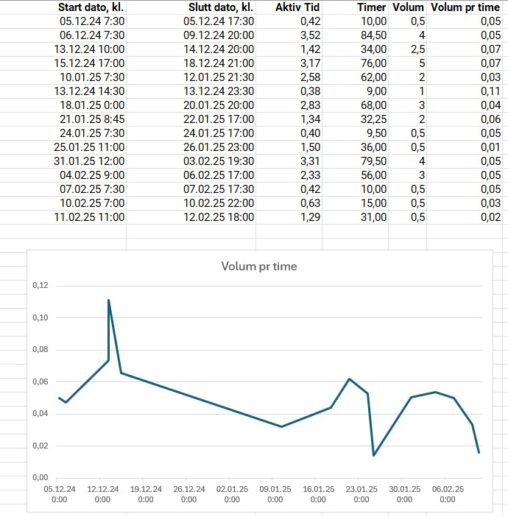
Graf som viser vannproduksjon i avfukter pr. aktiv produskjonstime for angitte avlesingsdatoer
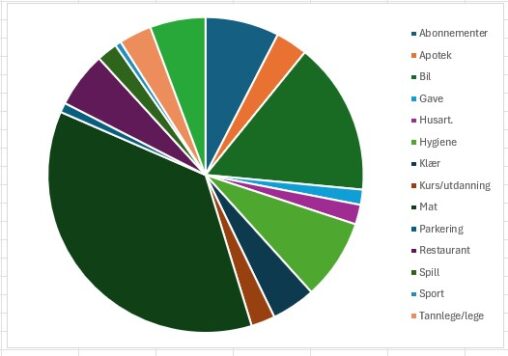
Hvor mye penger som brukes på mat i forhold til bil. Er bil billig?
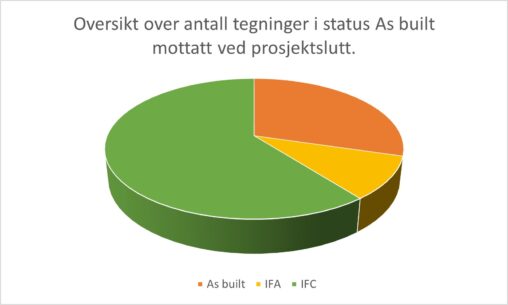
Oversikt over antall tegninger i status As built mottatt ved prosjektslutt.
Oversikt over mine oppvarmingsøkter på innendørssykkel over de siste tre ukene. Jeg har sett på varighet, hyppighet og aktivitetskalorier og funnet ut hvor mange aktivitetskalorier jeg forbrenner pr….
Oversikt over antall minutter syklet pr. uke over 3 uker, har så funnet frem data over antall aktivitetskalorier brukt samlet pr. uke over de samme tre ukene. Har…
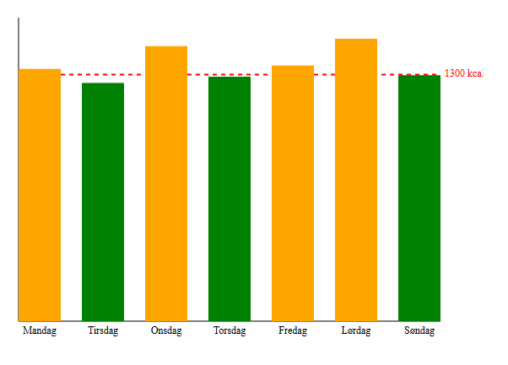
Søylediagrammet viser data over en ukes kaloriinntak. Diagrammet viser anbefalt kaloriinntak pr dag er 1300 kcal. Diagrammet gir oversikt over samlet kaloriinntak pr dag, samtidig som det gir…
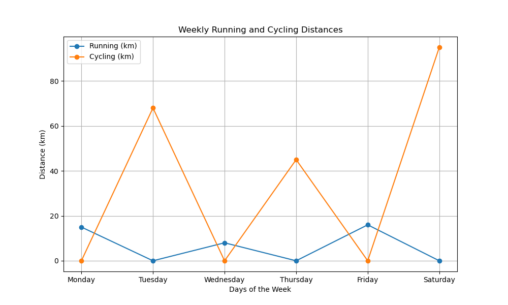
“Grafen viser ukentlige distanser for løping og sykling basert på data fra Garmin Connect for en spesifikk uke. X-aksen representerer dagene i uken (mandag til lørdag), mens Y-aksen…
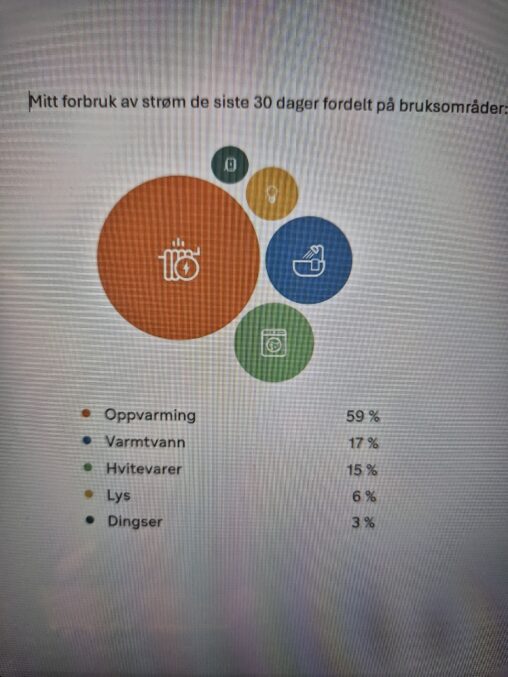
Her er det fremstilt strømforbruk i husholdningen fordelt på bruksområder i løpet av siste 30 dager. Figuren viser at største strømforbruket går til oppvarming av bolig.
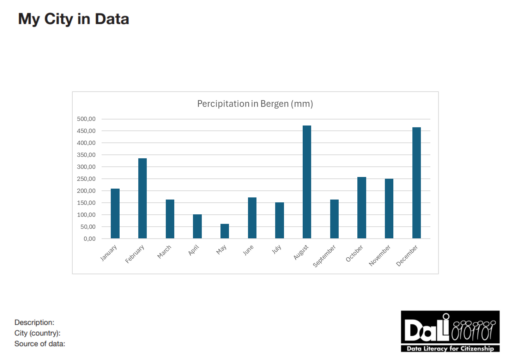
A visualization of the amount of Percipitation in milimeter in Bergen, Vestland, Norway in 2024 by month.
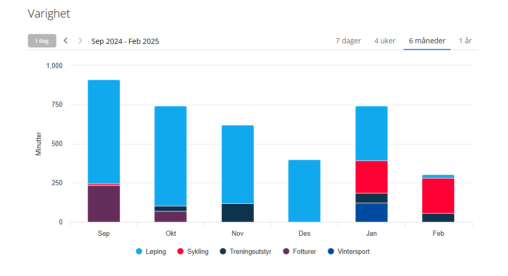
Visualisation of my training activities for the last 6 months. The activities are categorized into type of activity. Showing minutes trained per month.
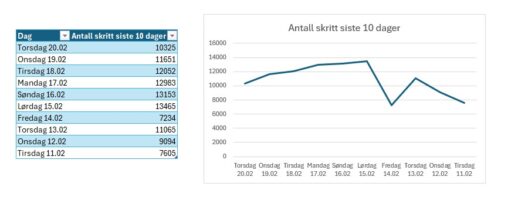
Dataen viser en oversikt over antall skritt jeg har hatt over 10 dager i perioden 11.02.25 – 20.02.25
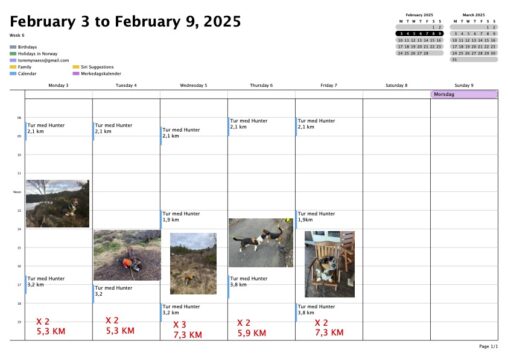
A weekly calendar where I have put down my walks with my dog. Here you find the time of day, the length of the walks, and how many…
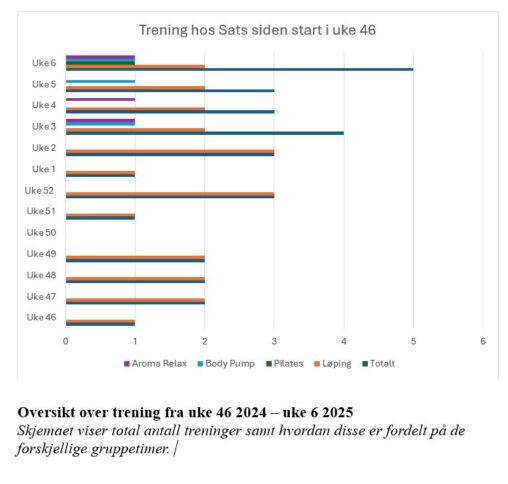
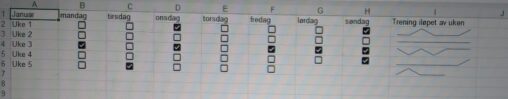
Oversikt over trening hos SATS for å sammenligne hva jeg har gjort mest av siden jeg startet. Oversikten viser også hvor mange ganger jeg har trent per uke.
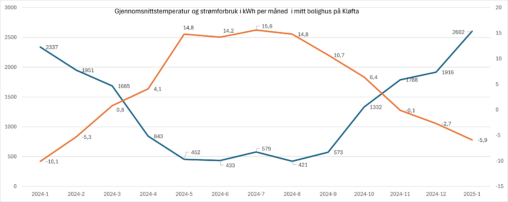
Gjennomsnittstemperatur er representert i Celsius grader pr måned. Strømforbruk representert i kilo Watt timer per måned
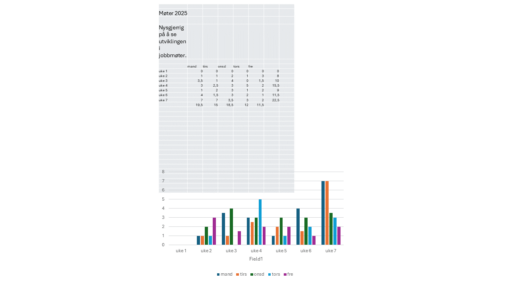
Dataene i tabellen viser antall timer hver dag i en uke som er brukt på møter i arbeidstiden. Deretter er tabellen gjort om til et stolpediagram. Ønsket var…
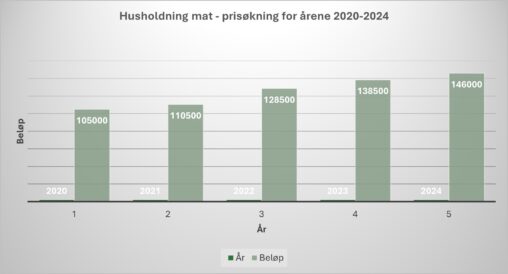
Stolpediagram som viser innkjøp av mat til familie på to og som samtidig til dels viser prisøkningen som har vært på matvarer i årene fra 2020 til 2024….