
1477 Data visualizations Categorized "30-64" (page 21 of 74)


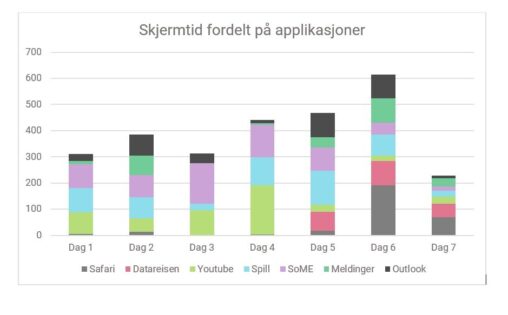
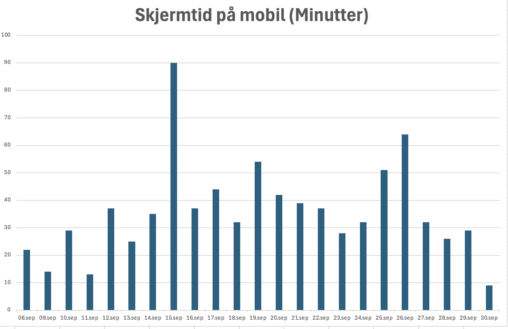
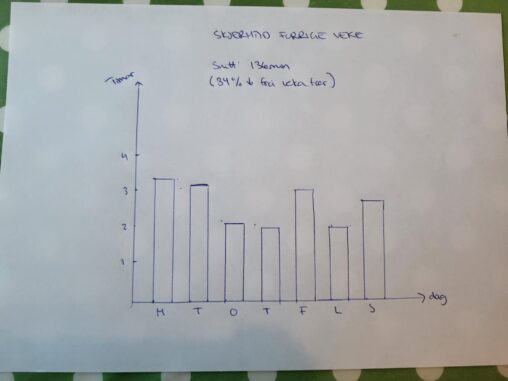
Skjermtid i minutter per dag, fordelt på ulike applikasjoner. Stolpediagrammet er laget i word.
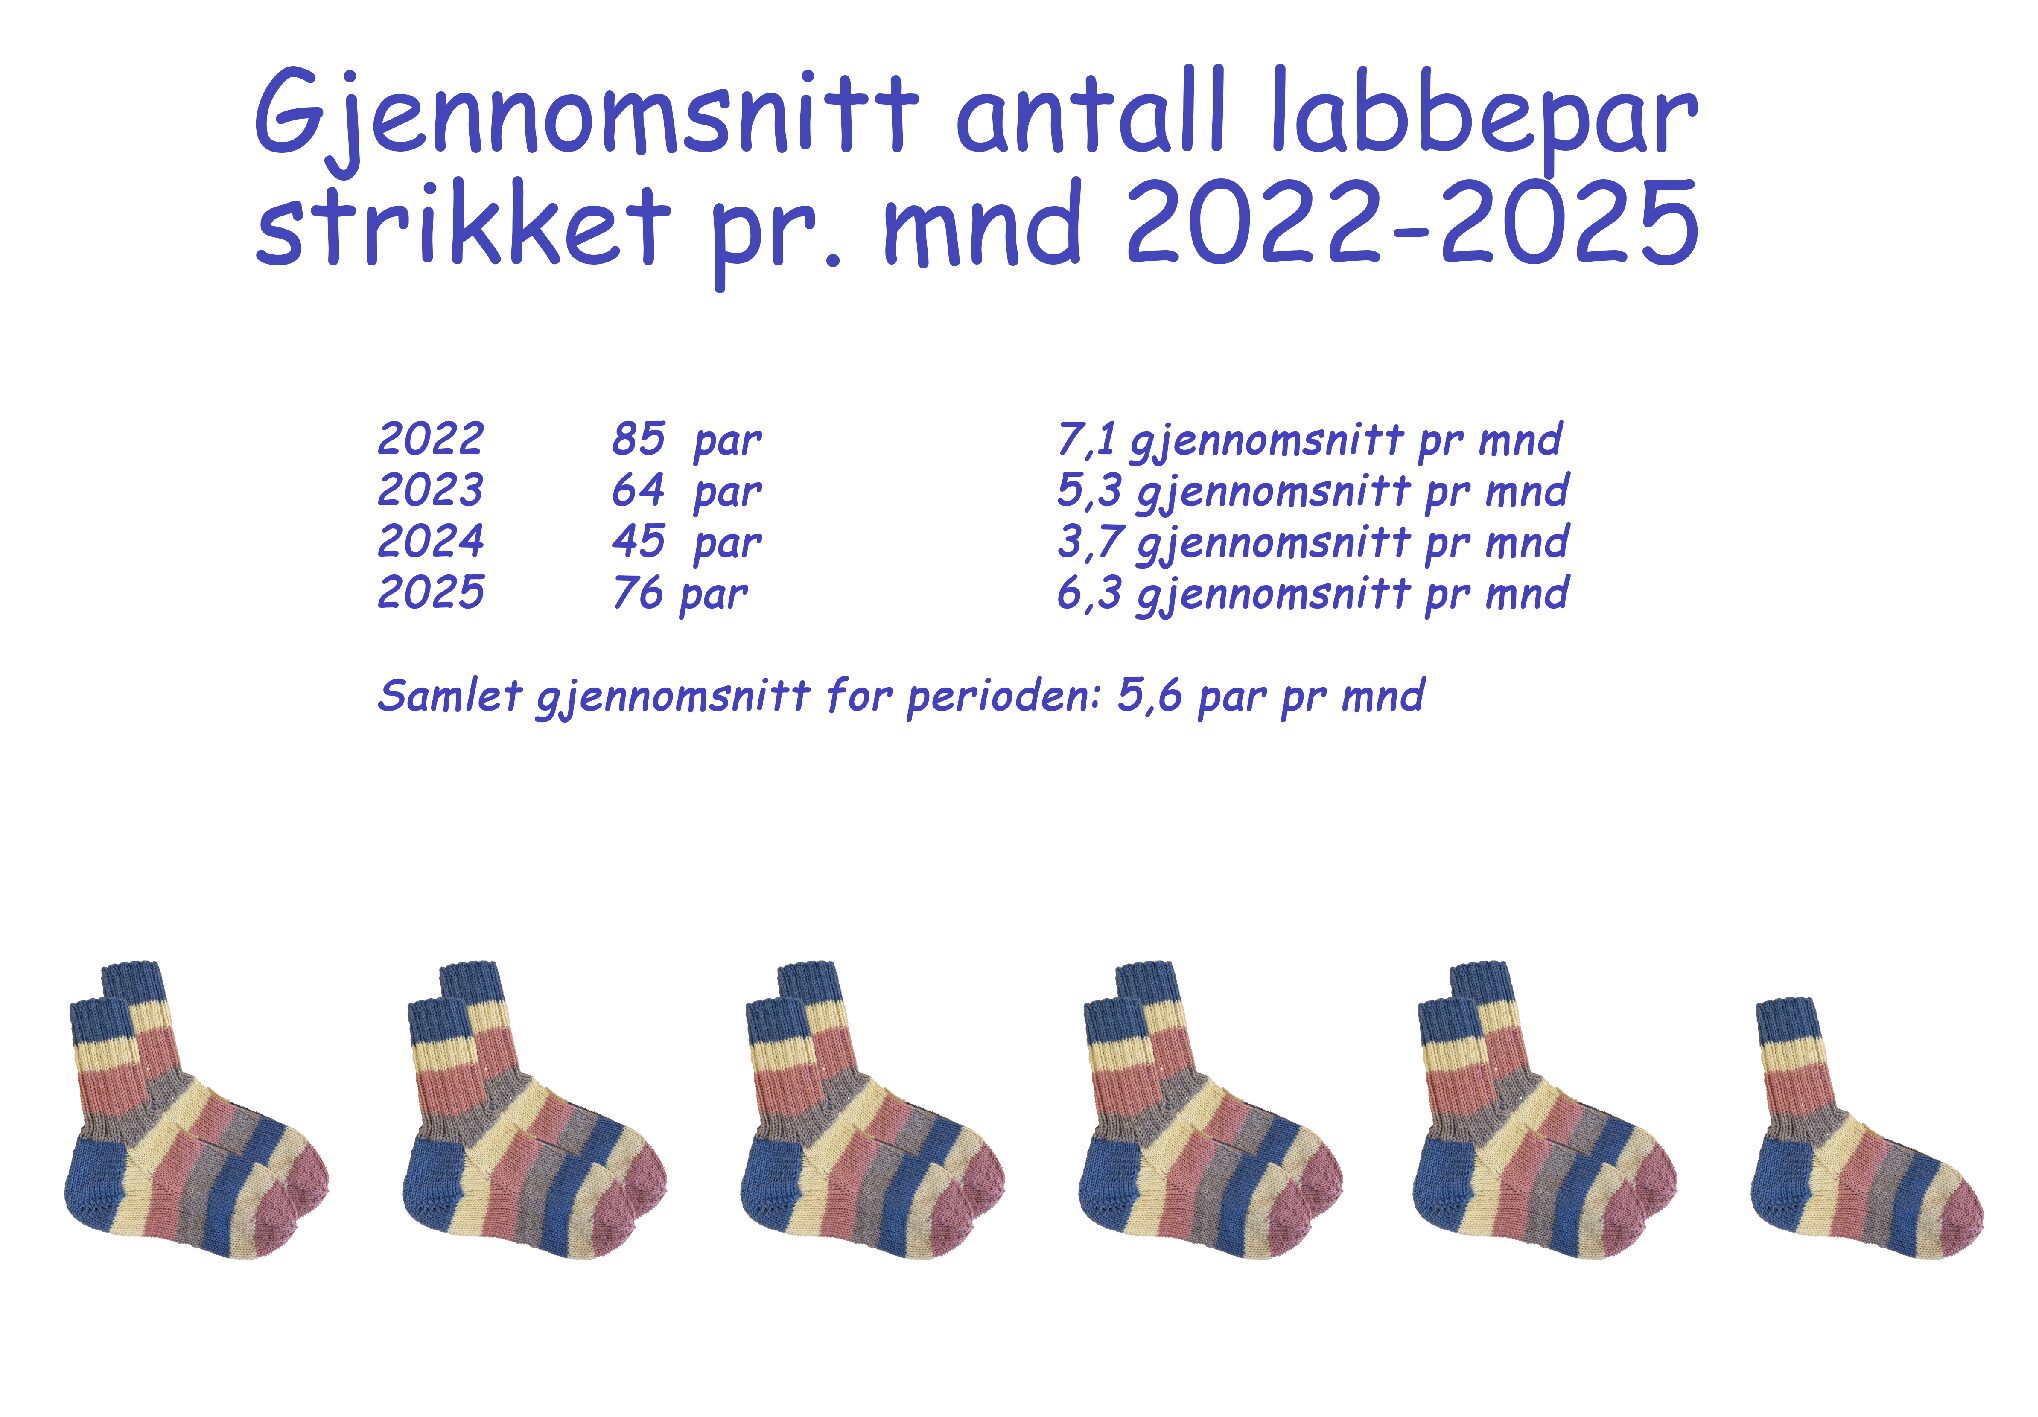
Jeg stikke mange labber og selger disse labbene til en liten butikk. I den forbindelse har jeg et eget lite regnskap over hvor mange labber jeg har solgt…
Eg er veldig glad i film, og bruker ein app som heiter Letterboxd, der ein m.a. kan logga kvar film ein ser på den datoen ein ser han….
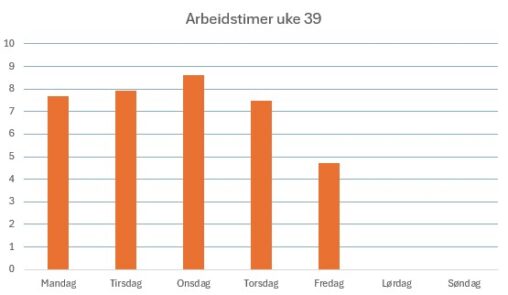
My working hours last week put in to Excel. After that I created a table for a visual presentation
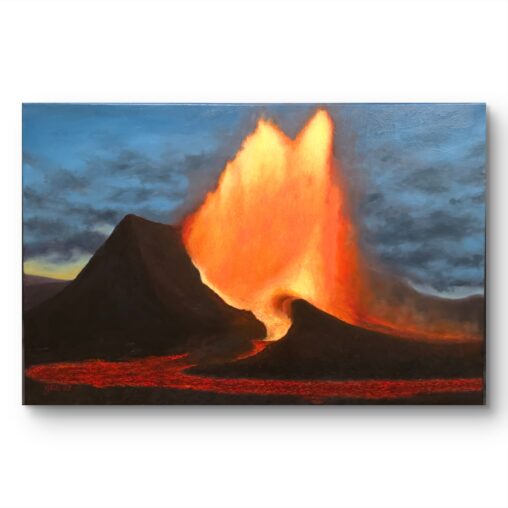
Dette er et maleri av et islandsk vulkanutbrudd, som jeg malte i for svigerinnen min i 2025. Hun er geolog og er veldig glad i vulkaner. Maleriet fikk…

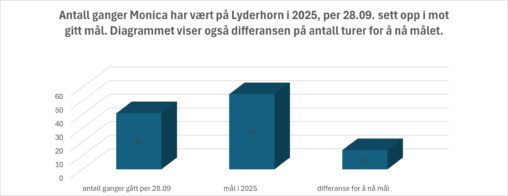
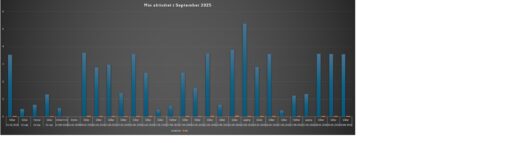
Diagrammet viser antall ganger jeg har gått opp på Lyderhorn i 2025 sett opp i mot mitt gitte mål. Videre er angitt hva som er differansen mellom antall…
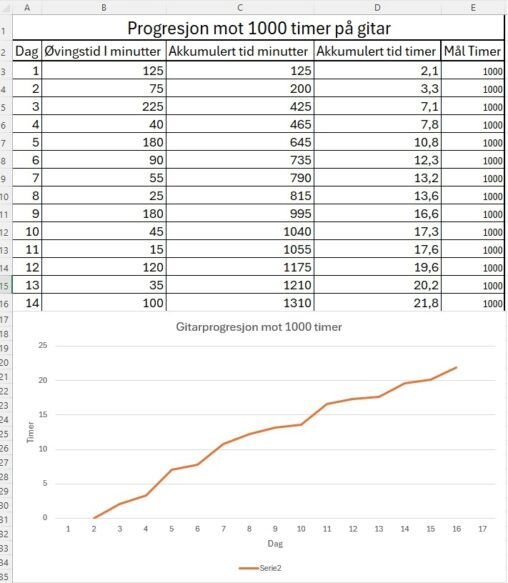
My guitarpractice towards being an expert with 10000 hours, with 1000hours as part goal
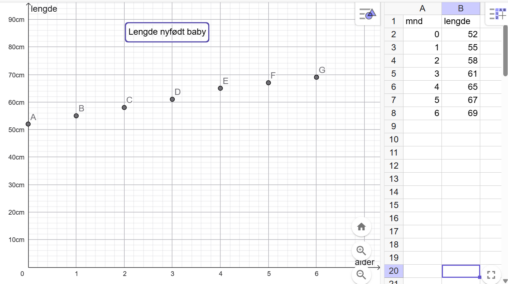
Her har jeg brukt en tabell med informasjon om en nyfødt baby sin lengde i 6 mnd etter fødsel. Jeg har brukt GeoGebra til å plotte punktene i…
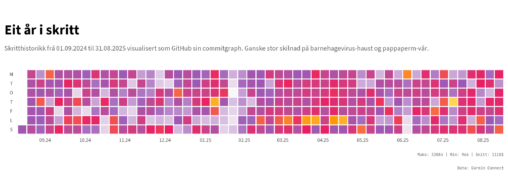
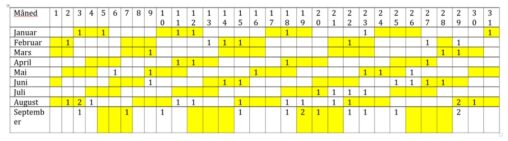
Varmekart i GitHub-stil som viser daglege skritt frå 1. september 2024 til 31. august 2025. Kvar rute representerer ein dag, farga etter tal skritt frå lågt (lyst) til…

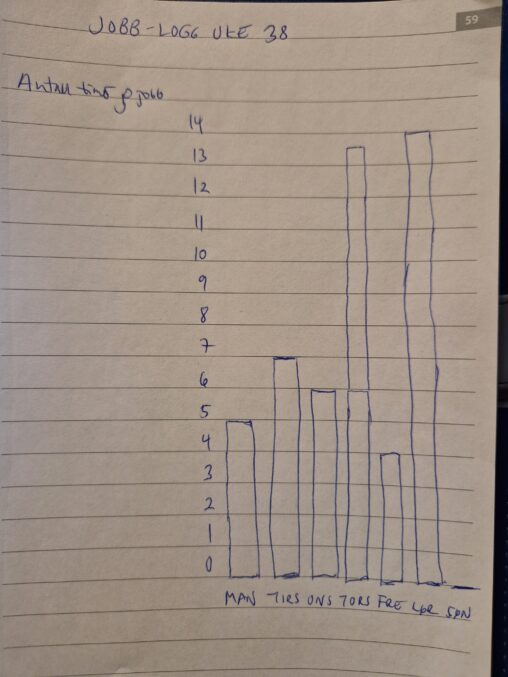
Antall timer tilbragt på jobb Mandag-søndag i uke 38 Tegnet bilde Copyright MVR
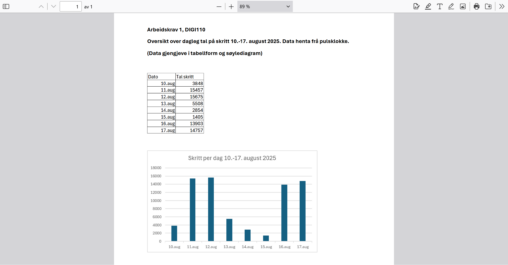
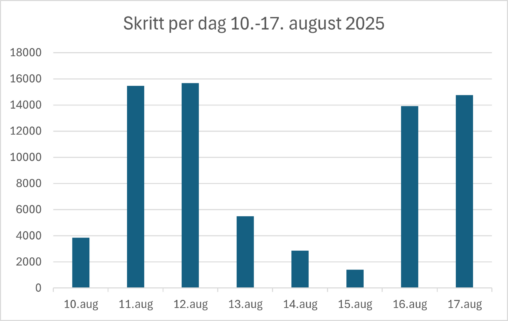
Dette er ei oversikt over dagleg tal på skritt for ei tilfedlig veke i august 2025. Data er henta frå appen Garmin Connect
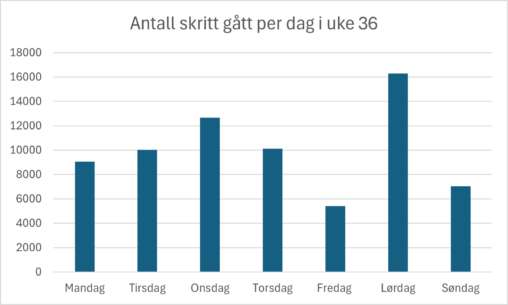
The chart visualizes the number steps I walked each day in week 36.