
1477 Data visualizations Categorized "30-64" (page 19 of 74)
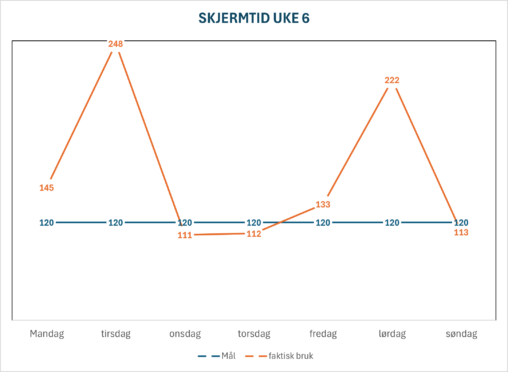
Oversikten viser skjermtid for uke 6 og overforbruk (mål: maks 120 minutter pr. dag).
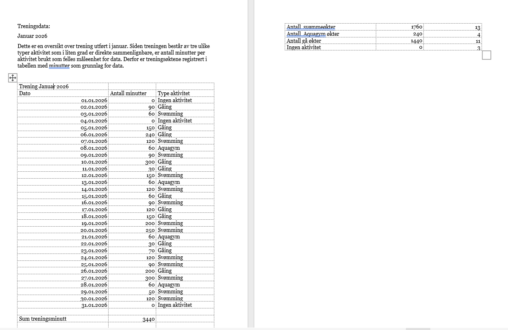
Dette er en oversikt over trening utført i januar. Siden treningen består av tre ulike typer aktivitet som i liten grad er direkte sammenlignbare, er antall minutter per…

Dette er en oversikt over trening utført i januar. Siden treningen består av tre ulike typer aktivitet som i liten grad er direkte sammenlignbare, er antall minutter per…
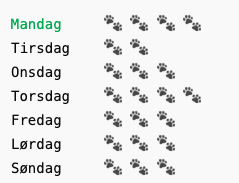
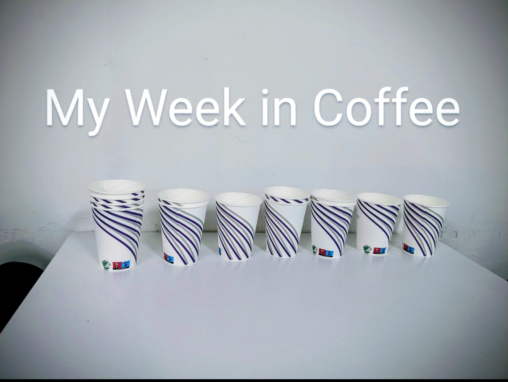
Denne visualiseringen viser hvor mange turer jeg går med hunden hver dag i løpet av én uke. Dataen er samlet manuelt og representerer en viktig del av hverdagen…
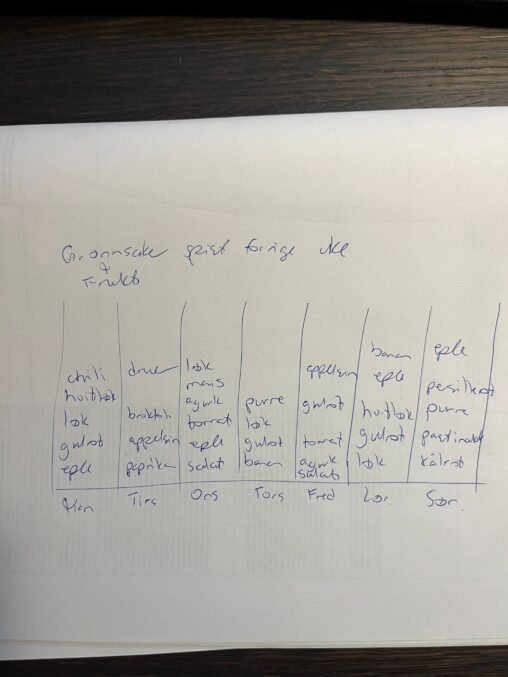
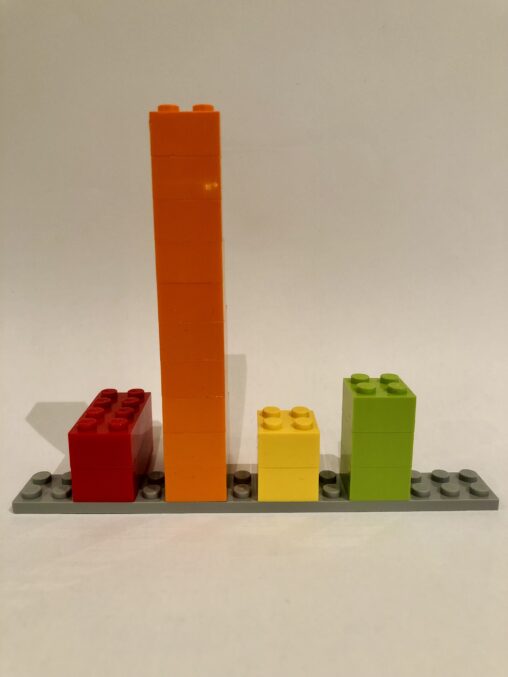
Jeg har tegnet manuelt en oversikt over hvilke grønnsaker og frukt jeg har spist hver av dagene man-søndag forrige uke.
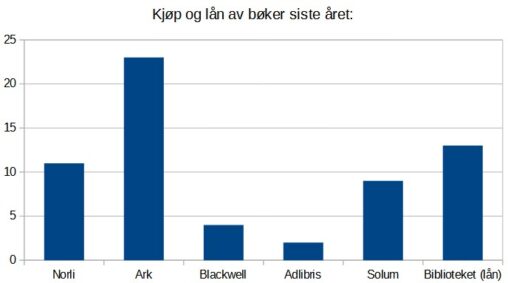
Diagram med seks søyler som visualiserer kjøp og lån av bøker det siste året. Seks søyler er: Norli 11, Ark 23, Blackwell 4, Adlibris 2, Solum 9 og…
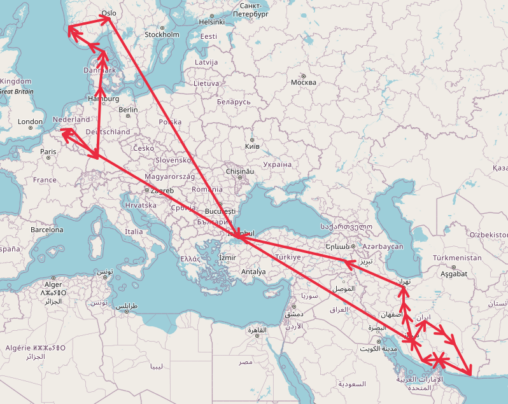
This is the rout between the cities I visited. Starting 2025.12.4 and ending 2026.01.18 in Haugesund. Planes, buses and boats were used for transportation. Hotels, hostels, private homes…

The x-axis is month of a year and y-axis is the walking distance in km. The data has been extracted from Fitness app on iPhone. I am the…

Visualiseringen viser hvor mange filmer som jeg har sett i de ulike sjangrene i løpet av året 2025.
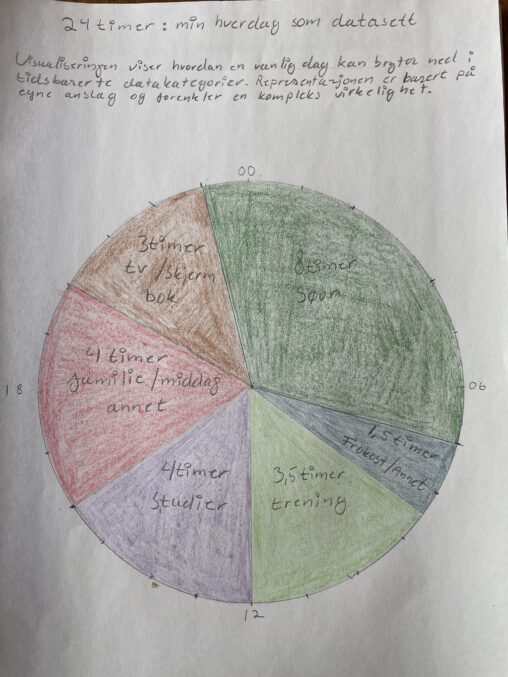
Visualiseringen viser hvordan en vanlig dag kan brytes ned i tidsbaserte datakategorier. Representasjonen er basert på egne anslag og forenkler en kompleks virkelighet. 8 timer søvn, 1,5 timer…
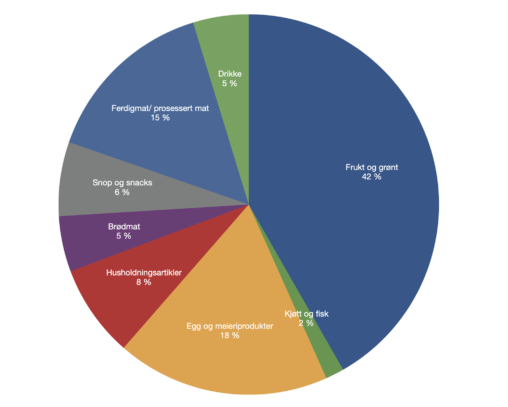
Prosentvis oversikt over hvilke type dagligvarer mitt hushold har handlet i januar 2026.
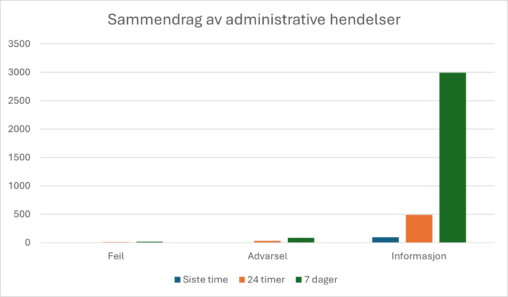
Administrative hendelser er en filtrert oversikt over hendelser hentet fra en rekke logger som datamaskinen holder oversikt over, fra blant annet system, applikasjoner, sikkerhet og oppsett. Den viser…
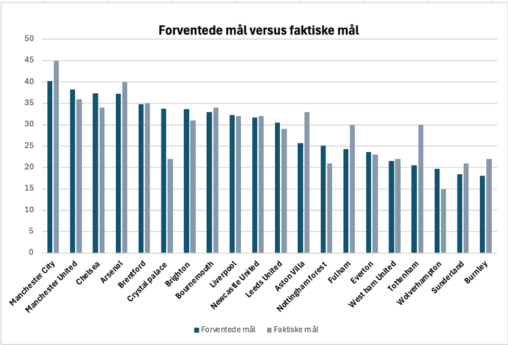
Delmappe 1) I denne deloppgaven har jeg valgt å analysere data rundt målscoring for fotball-lagene som deltar i årets 2025/2026 Premier League sesong. Jeg har brukt Excel som…
Visualisering gående/joggende personer med eller uten hund som jeg møtte på i motgående retning i løpet av en tur rundt Ortuvannet kl. 15:00-15:30. Rød: Gående person m/hund (2)…
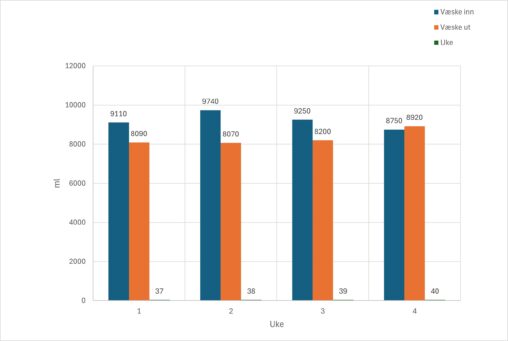
Måling av væske inntak vs væske målt ut av nyrer i løpet av 4 uker 11.9.25 til og med 8.10.25. Enhet som er brukt er milliliter. måling av…
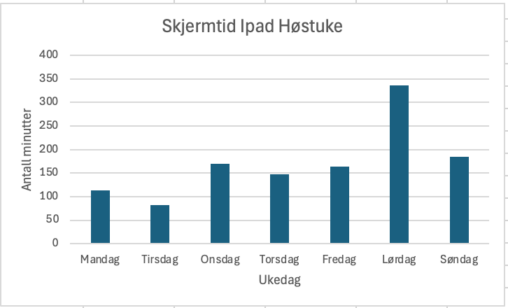
Søylediagram over skjermtid til en Ipad bruker i en høstuke. Hver uke dag har en søyle som viser skjermtiden til brukeren i minutter.
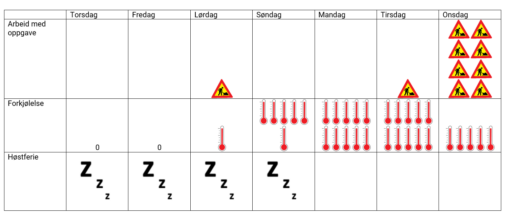
Picture describing 7 day flow containing work, a cold and a holiday. Data visualized by pasting own paintdrawings in to word.
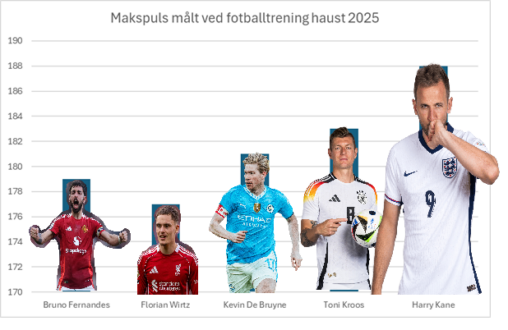
Max heart rate recorded by my Garmin training watch during football practice in autumn of 2025. Used Excel bar chart and it is heart rate in the y-axis,…