
1155 Data visualizations Categorized "18-29" (page 58 of 58)
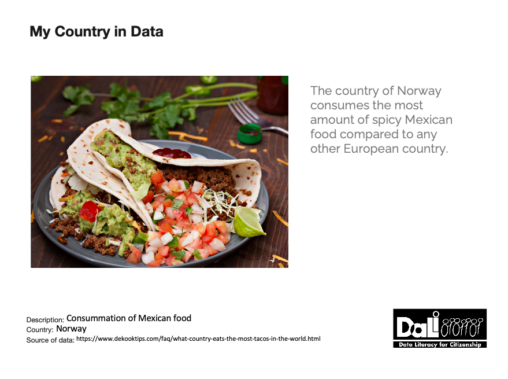
The country of Norway consumes the most amount of spicy Mexican food compared to any other European country.

This image details the amount of times I have been pooped on by a bird based on the countries I have visited where birds were present. Denmark: 1…
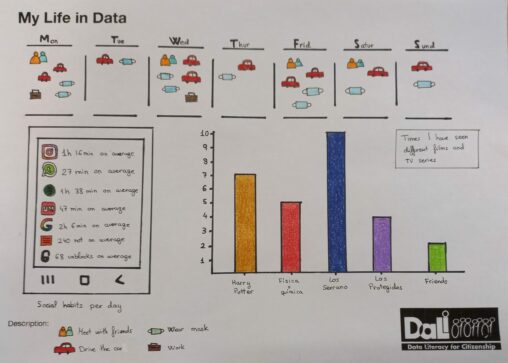
Here is represented my life in data, specifically my social habits per day (time I spend on different apps), what I usually do in the week regarding job,…
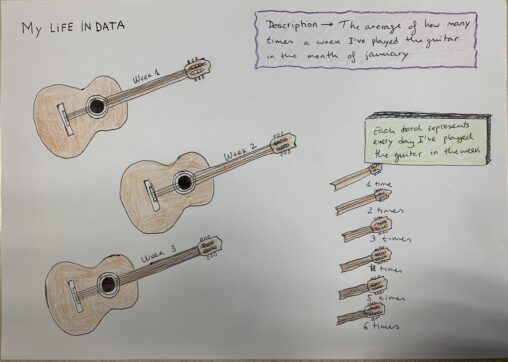
This picture represents the average of how many times a week I have played the guitar in the month of january. Each chord represents every day I have…
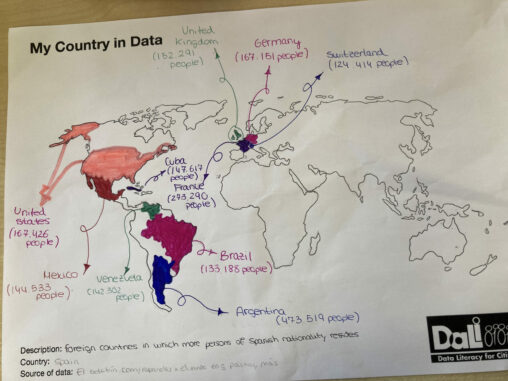
Is a world map that indicates the different countries and the number of Spanish inhabitants who reside there
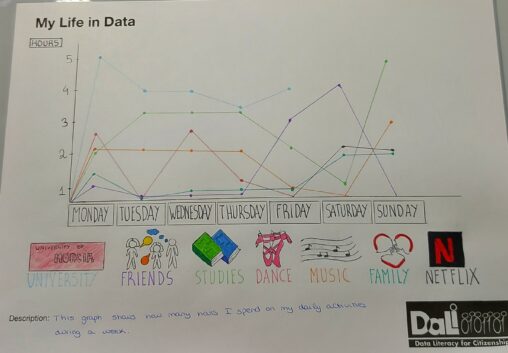
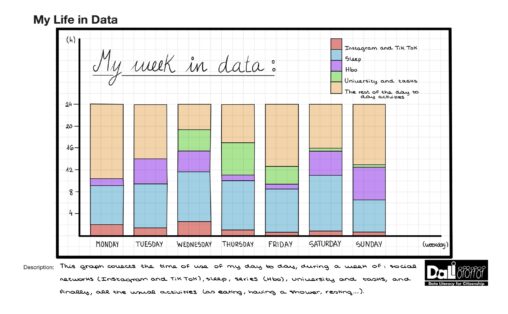
This is a graph representing the daily hours I spend on my daily activities over the course of a week, such as time spent studying or listening to…
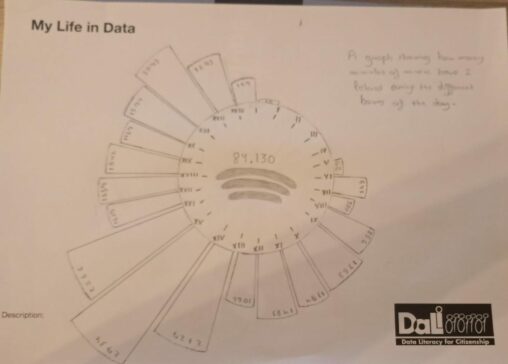
A graph showing how many minutes of music have I listened during the different hours of the day

In this graph I show the hours I dedicate to one of the things I love to do most in the world, teaching.

the average of how many times a week in the month of December 2021 have I exercised. You can see during each week the days that I have…
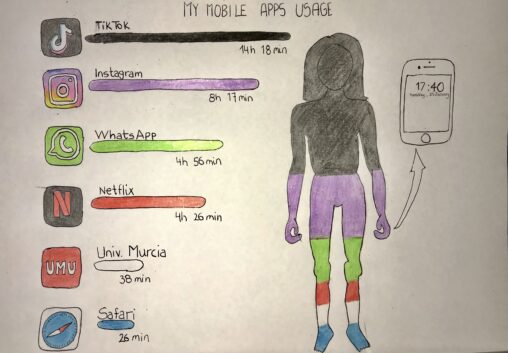
In this drawing I have decided to represent the estimated time that I use the differents apps of my mobile per week on my body. Some of this…


I’ve represented the average time I spend with my phone during weekdays. I show the average screen time during a period of hours. I used units of time,…
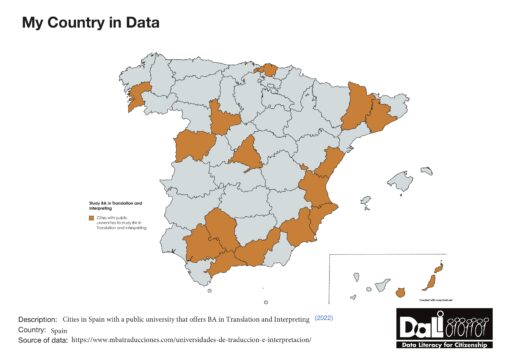
Map of Spain that highlights the cities where there is a public university that offers BA in Translation Creative Commons licence