1155 Data visualizations Categorized "18-29" (page 53 of 58)
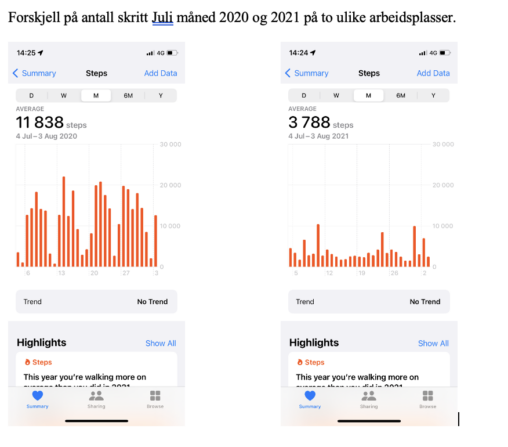
Statistikk hentet fra Helse-appen på Iphone. Viser antall skritt jeg gikk på to ulike arbeidsplasser i 2020 og 2021.
Written in English because of the language of the website. Realistically in Public Domain, since I uploaded it to this website. url=”http://www.themostamazingwebsiteontheinternet.com/”Min_digitale_hverdag_fra_min_telefon”
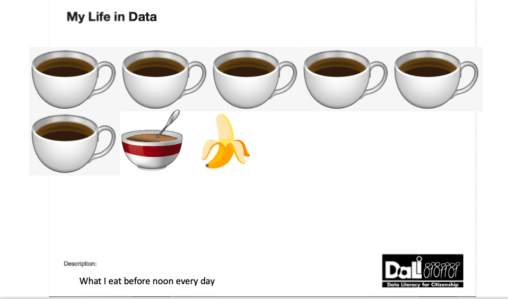
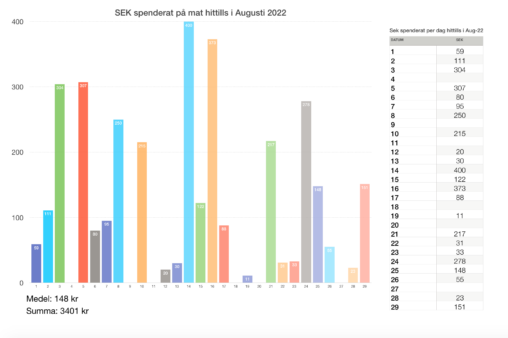
This is what I eat before noon every day. I have counted every cup of coffee over the last few days, and this is what I came up…
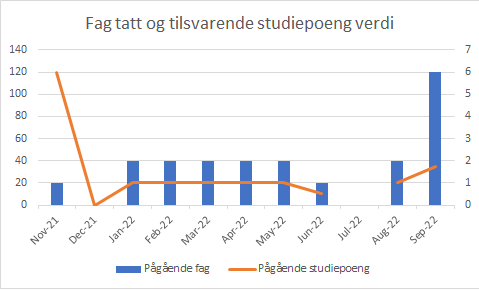
Fag tatt og tilsvarende studiepoeng verdier for individuelle måneder

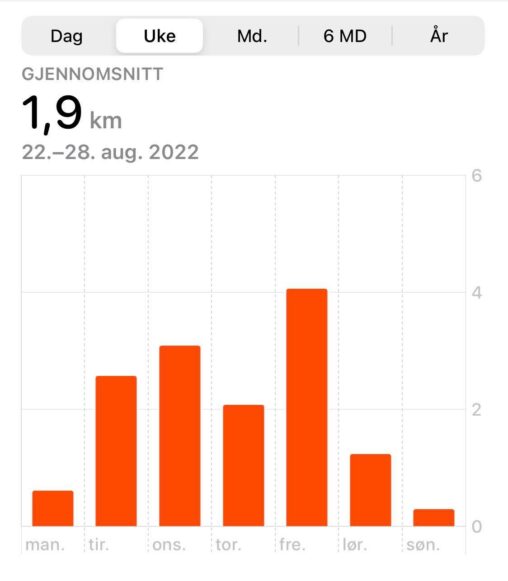
Elias sine treningstimer i uke 35 i årene hhv. 2022 og 2021
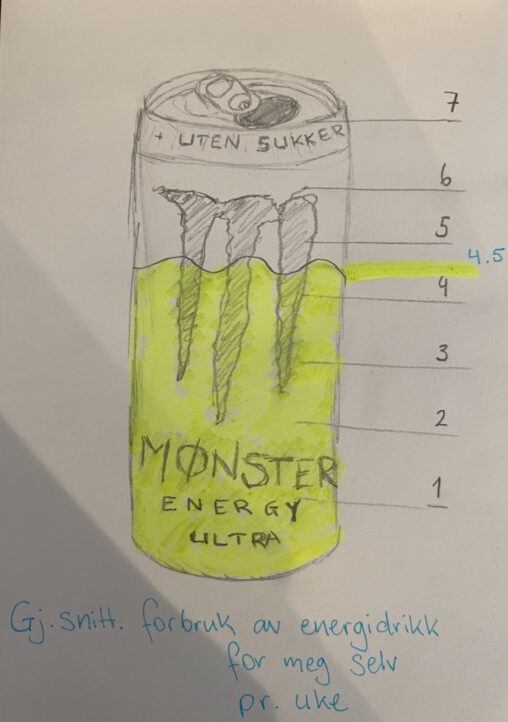
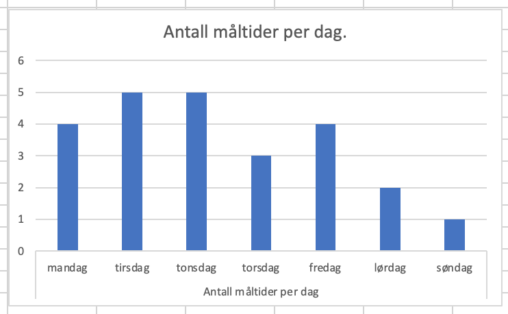
Min gjennomsnittlige forbruk av energidrikk i en vanlig uke. Tallene står for antall dager pr uke. Markert er 4.5 dager, som vil si jeg drikker en energidrikk daglig…
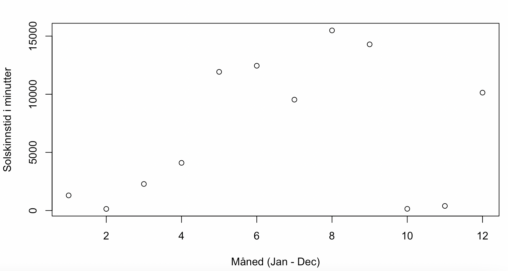
This data represents the total amount of sunshine in city full of rain. The data used is from the Geophysical Institute at the University in Bergen.
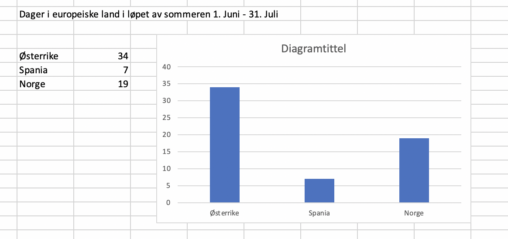
Hvor mange dager jeg brukte i forskjellige land i løpet av sommeren
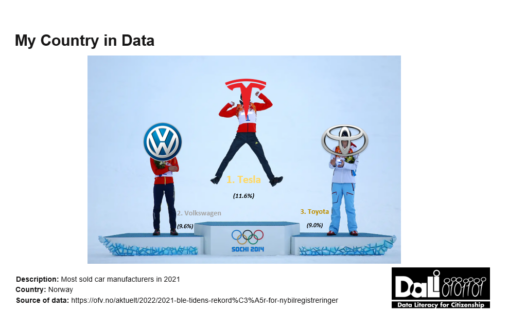
Visualization of the top three car manufacturers in Norway (2021) by the percentage of total car sales. Background photo: https://www.businessinsider.com/best-medal-winning-reactions-sochi-olympics-2014-2?r=US&IR=T
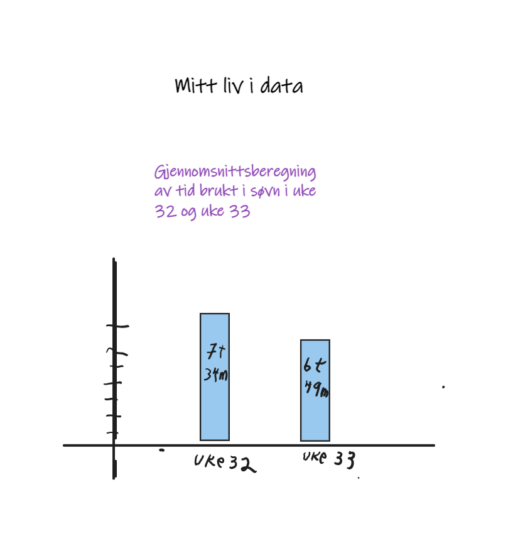
This is a representation of time spent sleeping in two weeks, mean of one week is represented as one column in the graph. Data is my own.
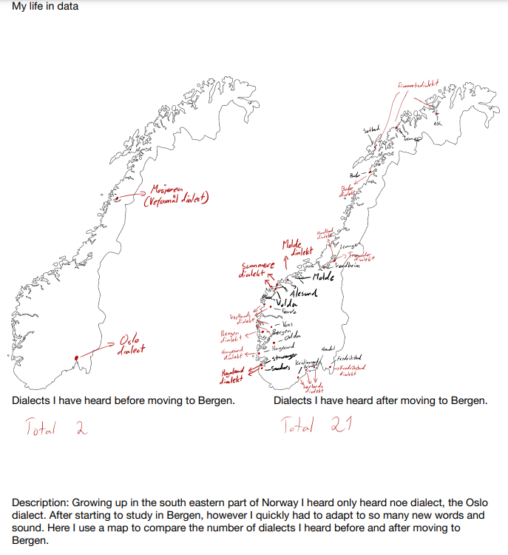
The illustration shows to maps of the country of Norway. The one on the left represensts the total number of dialects I encountered growing up, living on the…


This Image shows the average temperature of my hometown Osøyro so far through 2022. Instead of using numbers, it is color-coordinated. I used yr.no as my source.
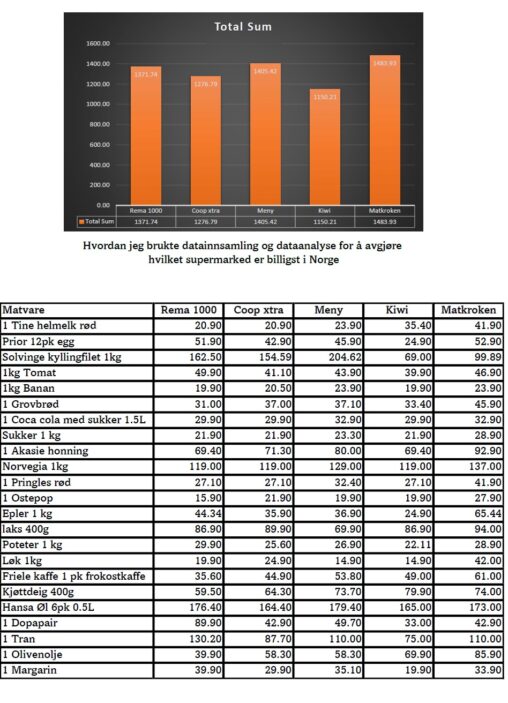
First, I made a list of a possible weekly shopping list. Then I went to different supermarkets and wrote down the prices of items on an Excel sheet…