
1155 Data visualizations Categorized "18-29" (page 5 of 58)

Hvor mange ganger jeg droppet frokost i uke 4 i 2026
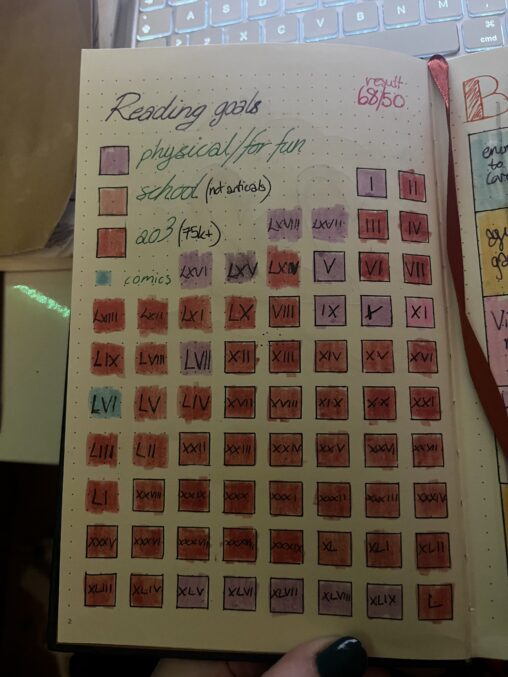
The picture gives out data from 68 different books read in 2024. And tells us both what kind of book it is and why it was read. The…

Skjermtid per dag for uke 4 i 2026. Skjermtid inkluderer mobil, pc og ipad. X aksen representerer dagene i uken og y aksen antall timer. Snittet per dag…

This visualization shows how many cups of coffee I drink during workdays and how I rate my sleep quality on a scale from 1 to 10. The data…

Dataene viser min ukentlige fremgang i kinesisk: antall ord og tegn lært i hver av de første tre ukene med faget.
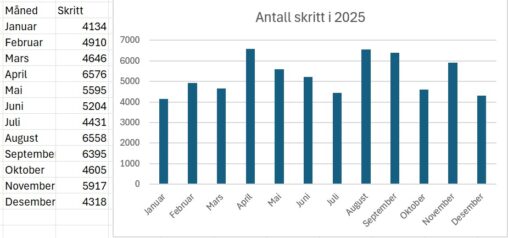
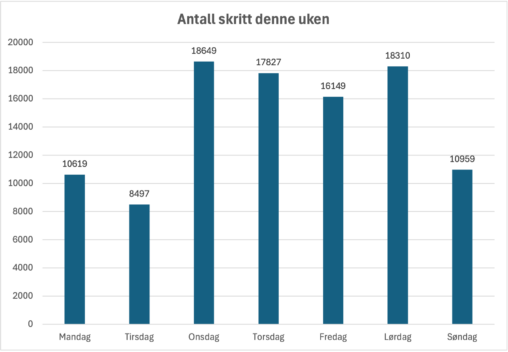
Dette representerer hvor mange skritt som har blitt registrert på helse applikasjonen på telefonen min. Den viser ikke et nøyaktig antall skritt, ettersom at jeg ikke går rundt…

Bøker fra bokhylla og hvor mange stjerner jeg ga de på Goodreads

This represents 2 weeks of my life in 2026 where I actively tried to improve my average sleep, and I suceeded, as shown by the data presented. I…

Grafen visualiserer søvnscore resultater i løpet av første uken i 2026, ved bruk av søylediagram.

Her er mitt søvnmønster i løpet av uke 4 i 2026. Den deles inni klokkeslett når jeg sto opp og la meg hver dag. For eksempel mandagen så…

Here is a visualisation in Minecraft of the amount of hours I have used my phone every day for week 4. On the left the hours are shown…

Denne visualiseringen viser antall skritt jeg har gått per dag i løpet av uke 4 (mandag- søndag). Dataene er målt i antall skritt per dag og samlet inn…
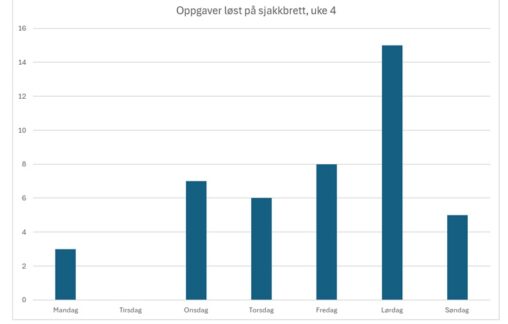
Dette er en visualisering av sjakkoppgaver fra uke 4 (19-25.1.26) som del av en oppgave i DIGI110 våren 2026.


The bar chart shows the number of steps per day for the period 19/01/26–25/01/26 (Monday–Sunday). The data was recorded by my Garmin device.

The bar chart shows a representation of daily screen-time through week 4 of 2026. The data is provided by Apple, and is extracted from my iPhone.
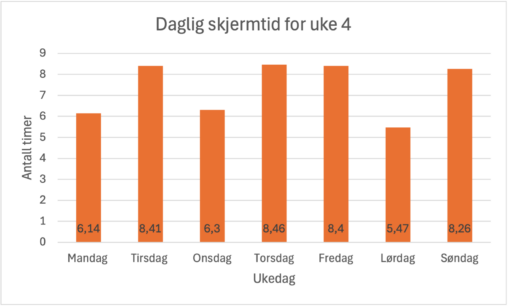
Visualisering av min daglige skjermtid i uke 4. Dataen reflekterer et liv som i stor grad leves digitalt, både på jobb og i helgen. Visualiseringen reflekterer også et…
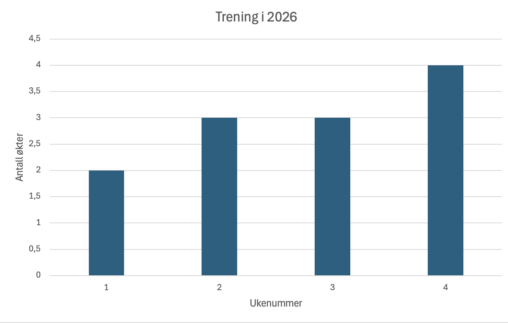
Visualization of amount of workouts per week in 2026. Datas are 2 workouts in week 1, 3 in week 2, 3 in week 3 and 4 in week…