
1155 Data visualizations Categorized "18-29" (page 42 of 58)
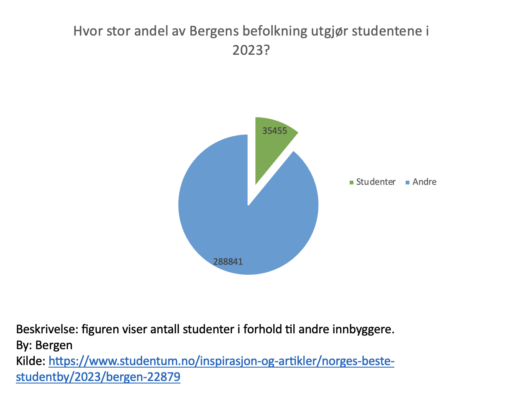
Denne figuren viser antall studenter i forhold til andre innbyggere i Bergen i 2023, og viser at blant 324 296, utgjør 35 455 av disse studenter. Dataen er…
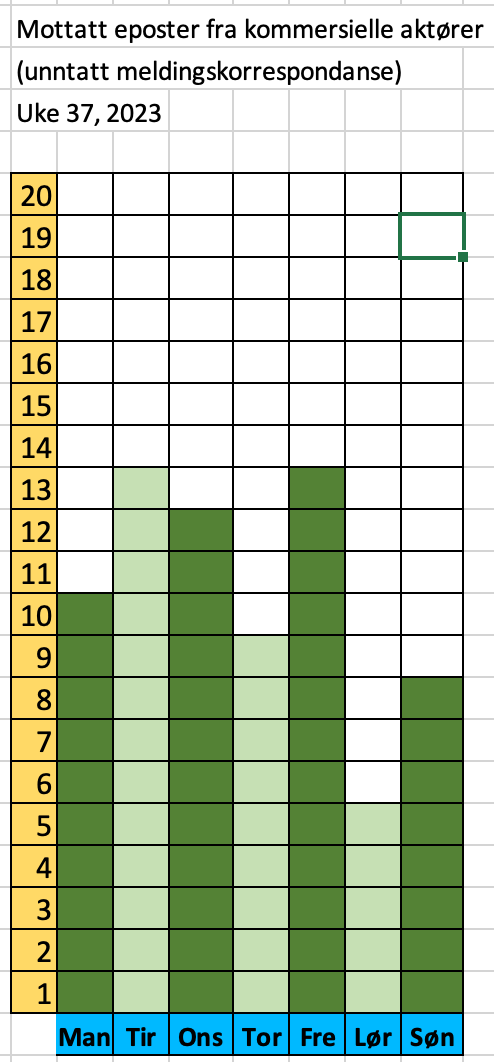
Epost per dag, veke 37 (tatt bort meldingskorrespondanse og varsel om meldinger) Man 11. 10 Tir 12 13 Ons 13 12 Tor 14 9 Fre 15 13 Lør…
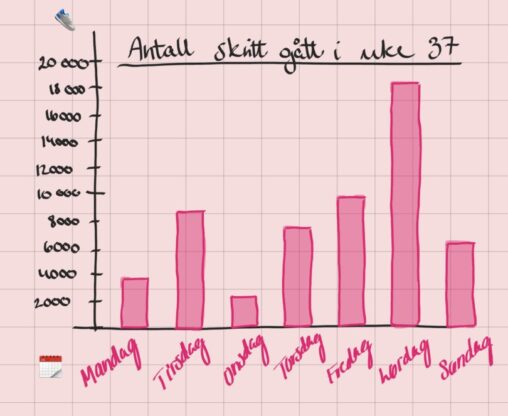
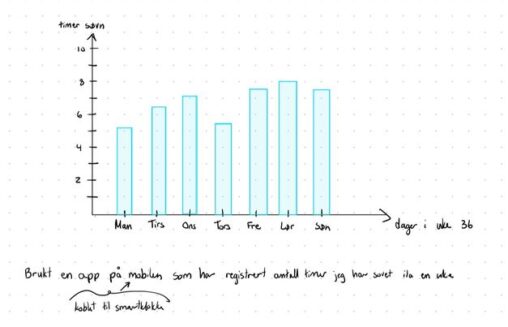
Bildet viser grafisk framstilling av hvor mange skritt jeg har tatt de ulike dagene i løpet av den siste uka.

The bar graph displays the calculated cost per distance (NOK/km) for the various trips of the journey I took to my exchange destination in June 2023. Each individual…
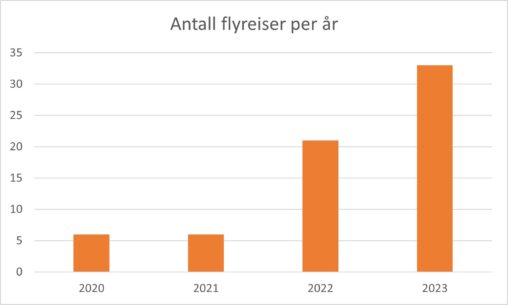
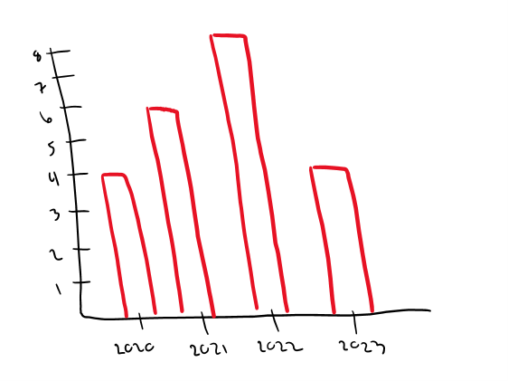
Graf som viser hvor mange fly jeg har tatt per år (2020-2023). De gangene jeg har hatt flybytte, er begge flyene telt med.
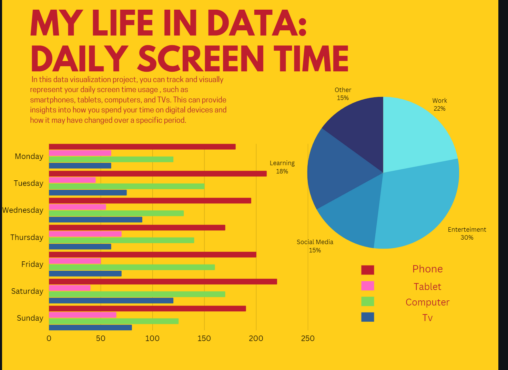
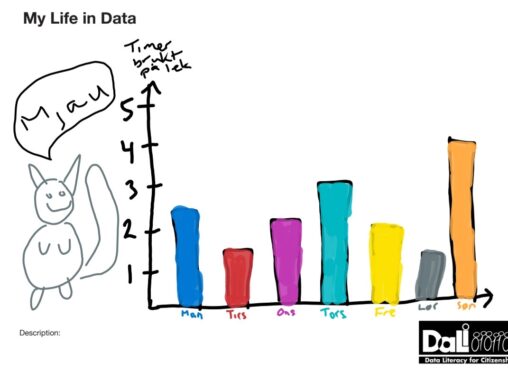
In this data visualization project, you can track and visually represent your daily screen time usage across different devices, such as smartphones, tablets, computers, and TVs. This can…
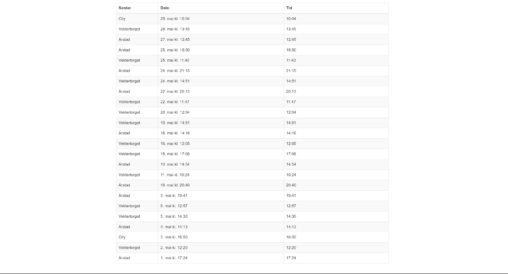
Denne dataen viser mine registreringer på sammen sine treningssentere i mai, inkludert klokkeslett og hvilket senter jeg brukte.
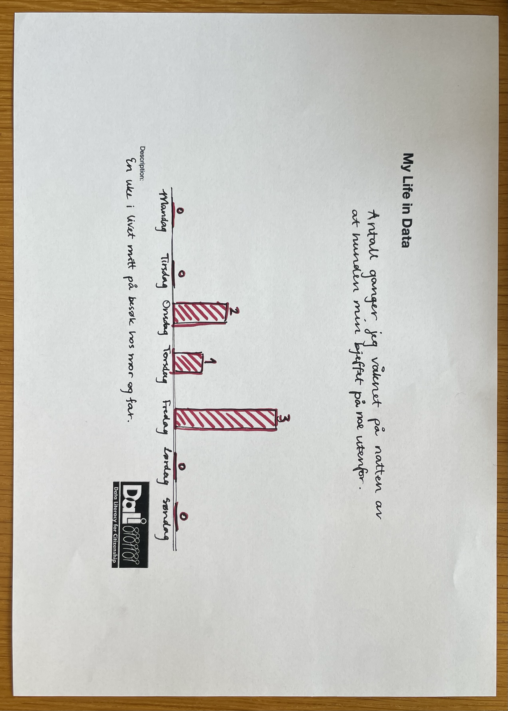
Antall ganger jeg våknet på natten av at hunden min bjeffet på noe utenfor.
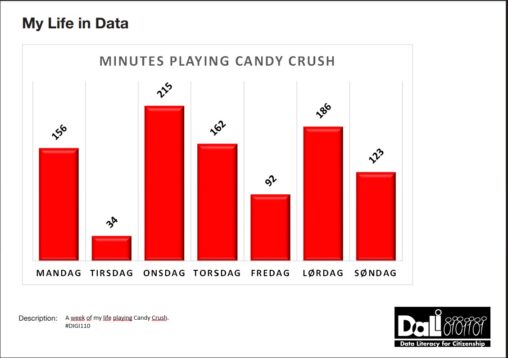
How many minutes i played candy crush on my phone the first week of september.
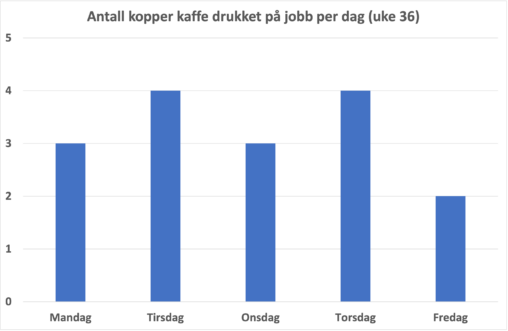
Diagrammet viser en oversikt over hvor mange kopper jeg drakk per dag i uke 36.
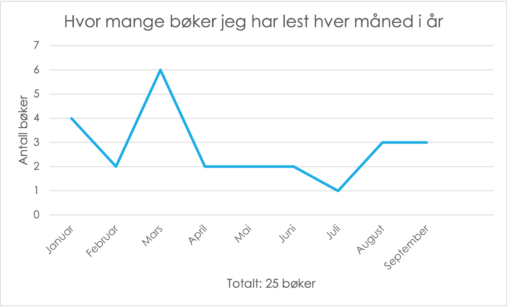
Jeg har laget et linjediagram som viser hvor mange bøker jeg har lest hver måned så langt i 2023.
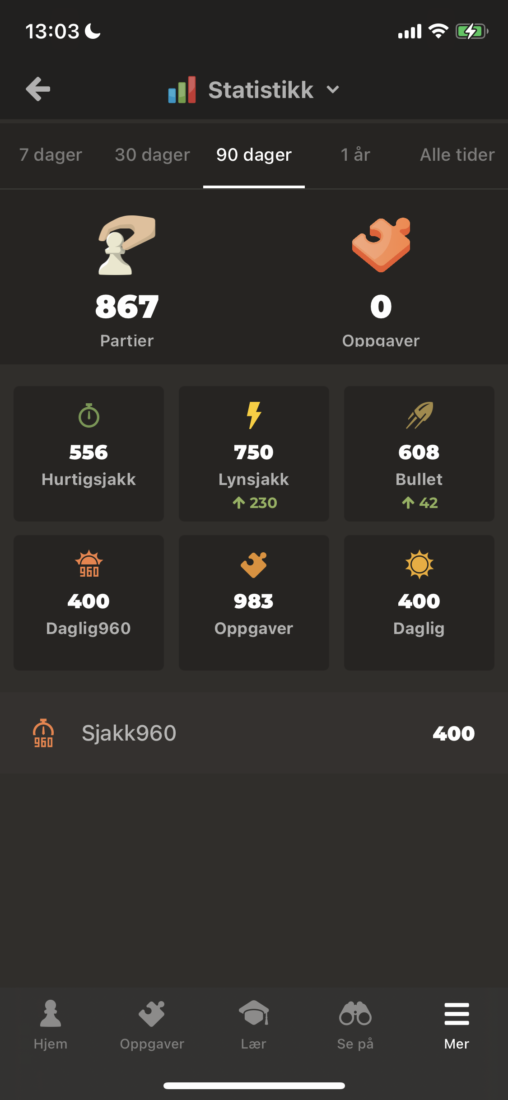
Antall partier med sjakk på chess.com de siste 90 dagene. Burde hatt høyere rating så mye jeg spiller:)
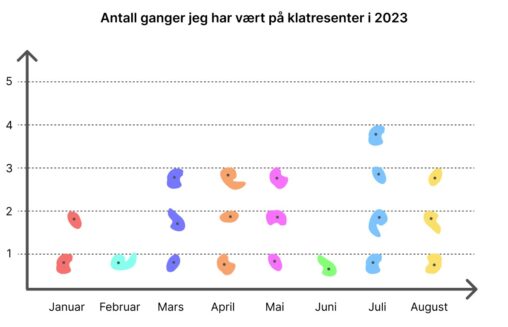
Oversikt over hvor mange ganger jeg har vært på klatresenter fra januar til august i 2023.
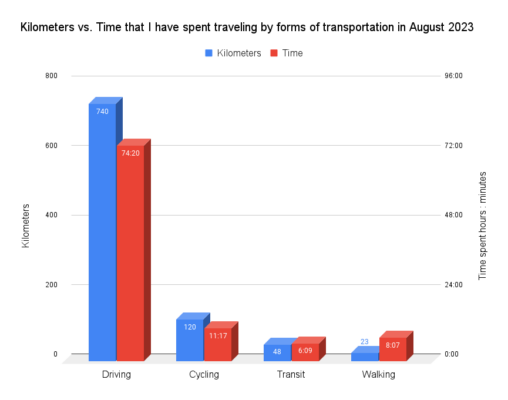
Kilometers vs. Time that I have spent traveling by forms of transportation in August 2023. 2 series of data: total distance traveled (kilometers), and total time/duration (hours:minutes) of…
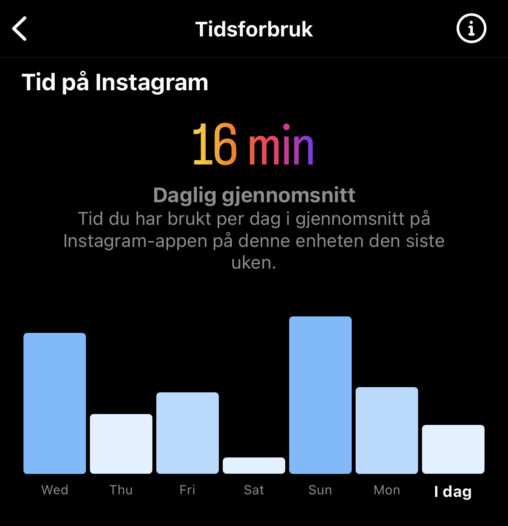
Skjermbilde av diagram som viser hvor mye tid jeg har brukt på Instagram den siste uken.
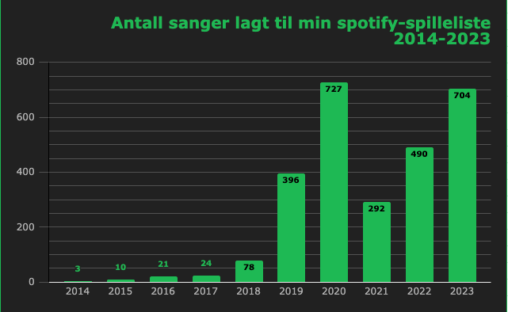
Siden 2014 har jeg samlet alle sangene jeg liker uavhengig av hverandre på en spilleliste. De siste ni årene har jeg totalt samlet 2745 sanger, hvor jeg la…