
1154 Data visualizations Categorized "18-29" (page 4 of 58)
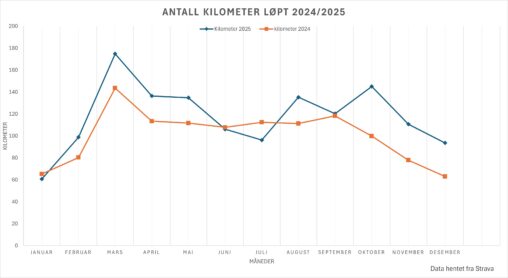
Denne grafen viser månedlig løpedistanse målt i kilometer for 2024 og 2025. Dataen er hentet fra registrerte løpeaktiviteter i Strava. For 2024 dekker tallene perioden fra 1. januar…
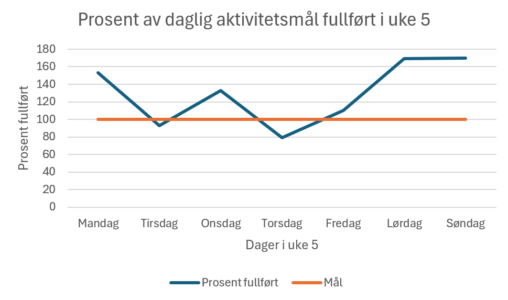
Diagrammet er laget i Excel basert på målinger gjort av ei pulsklokke. Aktivitetsmålet er beregnet av klokken, og aktivitet jeg gjennomfører registreres i løpet av dagen og beregnes…
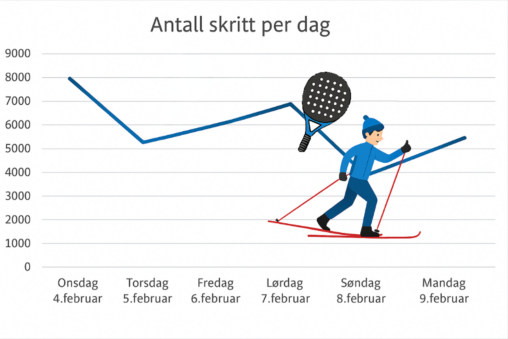
Data om antall skritt hver dag er hentet fra treningsklokken min. Jeg har lagt inn disse dataene Excel og deretter brukt Copilot til å visualisere tabellen med ikoner…
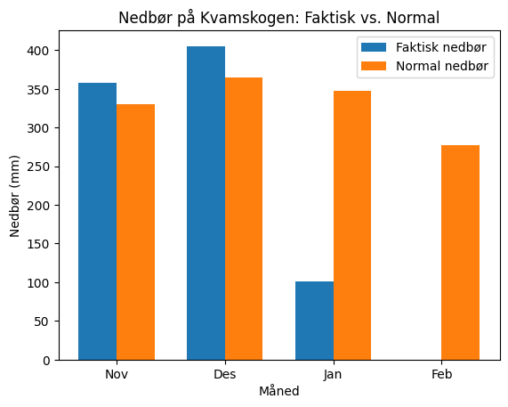
Visualiseringen viser at nedbøren på Kvamskogen var høyere enn normalen i november og desember 2025, mens januar og februar 2026 hadde betydelig lavere nedbør enn normalen.
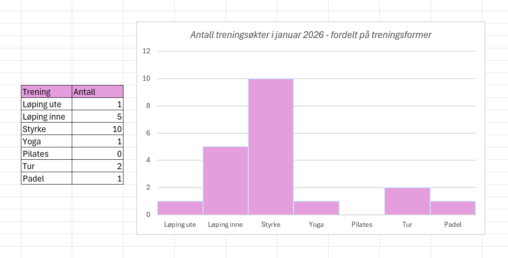
Dette er en oversikt av treningsøkter i januar 2026, fordelt på de ulike treningsformene jeg bruker.
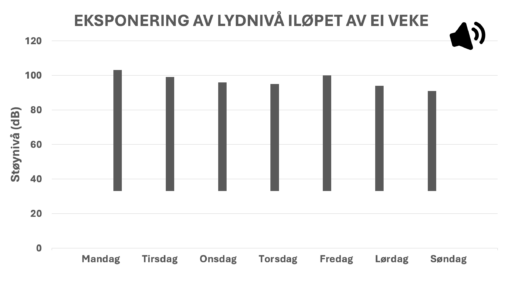
Stolpediagram som viser eit område av lydnivå ein smartklokke har registrert iløpet av ei veke, fordelt på kvar dag. Støynivået er målt i desibel (dB). Lågaste nivå på…
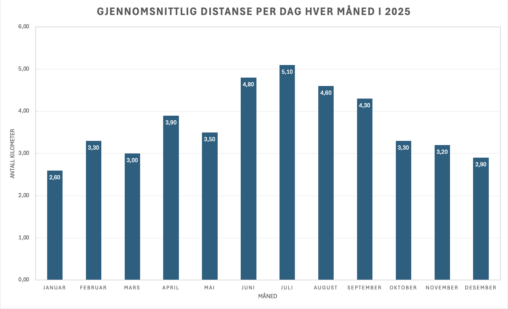
Gjennomsnittlig distanse per dag hver måned i 2025. Distansen er i kilometer.
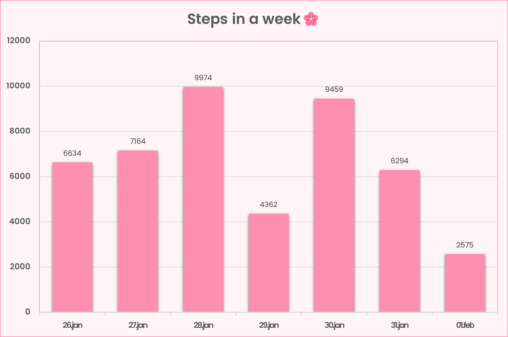
Daily recorded step counts for each date in week 5, from 26 January to 1 February. The chart presents the following values: 6,634 steps on 26 January, 7,164…
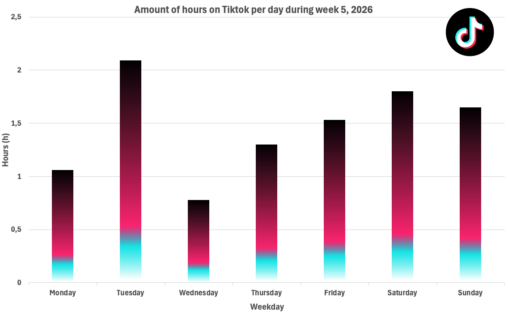
Graph shows the amount of hours (h) used on Tiktok per day (Monday – Sunday) during week 5 in 2026. Creative Commons licence. Data collected from screen time…
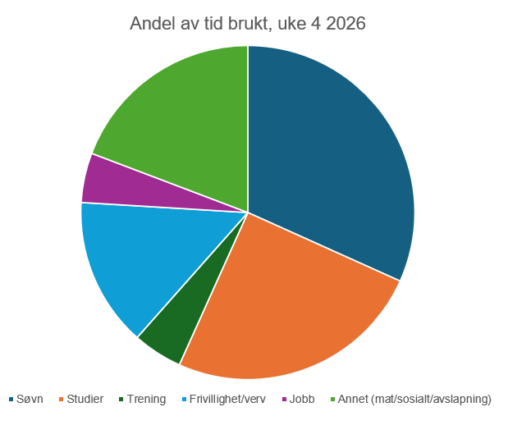
Visualisering av tid brukt ila. uke 4 på diverse aktiviteter. Data plottet inn i Excel dag for dag, overført til PP for visualisering.
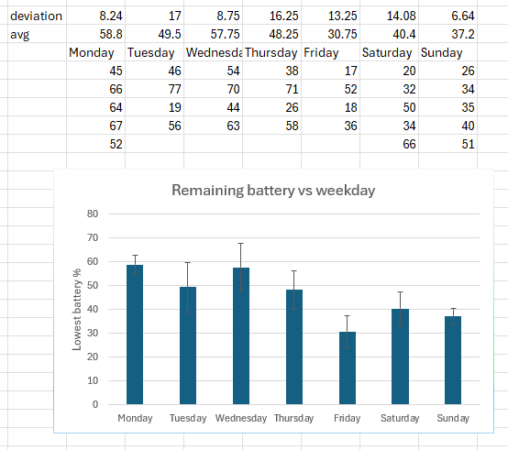
I tracked remaining battery on my phone each day before plugging it in to charge. I think what the data shows is that I am less on my…
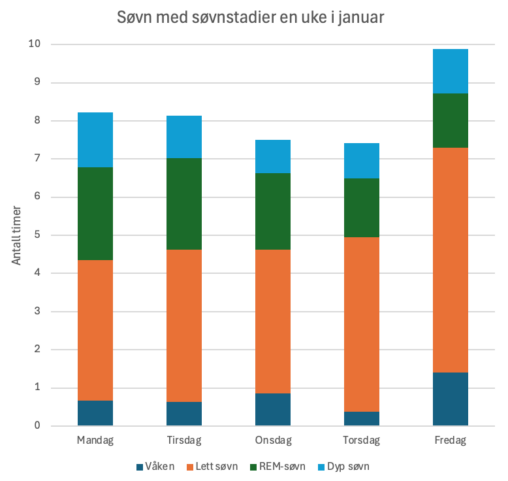
Figuren viser antall timer søvn en arbeidsuke i januar. Hver stolpe er delt opp i antall timer tilbrakt våken, i lett søvn, REM-søvn og i dyp søvn. Y-aksen…
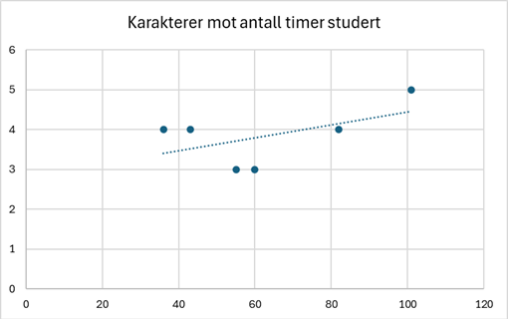
The visualization shows a scatter plot that plots the hours spent studying for six separate 10 ECTS university level courses of varying difficulty and the grade of the…
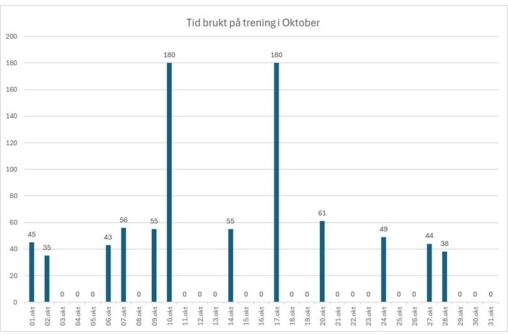
Visualisering av tid brukt på trening i Oktober 2025. Tid er i minutter. Data er kopiert fra appen Hevy, som blir brukt til å logge treningsøkter. Figuren er…
Hvor mange timer har eg brukt i en uke på sosiale media 168 timer i en uke, 8 timers søvn er eksludert fra dette; 112 timer igjen 81…

I faget BIO205 har vi fått data fra 2021 til 2025 over årstall, butikk, produkt, artsnavn, pris per enhet, pris per kilo og miljømerking. I år var vi…

Hvor mange ganger jeg droppet frokost i uke 4 i 2026