
1155 Data visualizations Categorized "18-29" (page 37 of 58)

These are some of my nails I’ve been doing over last year until now. These are the colors that I have done during this time.
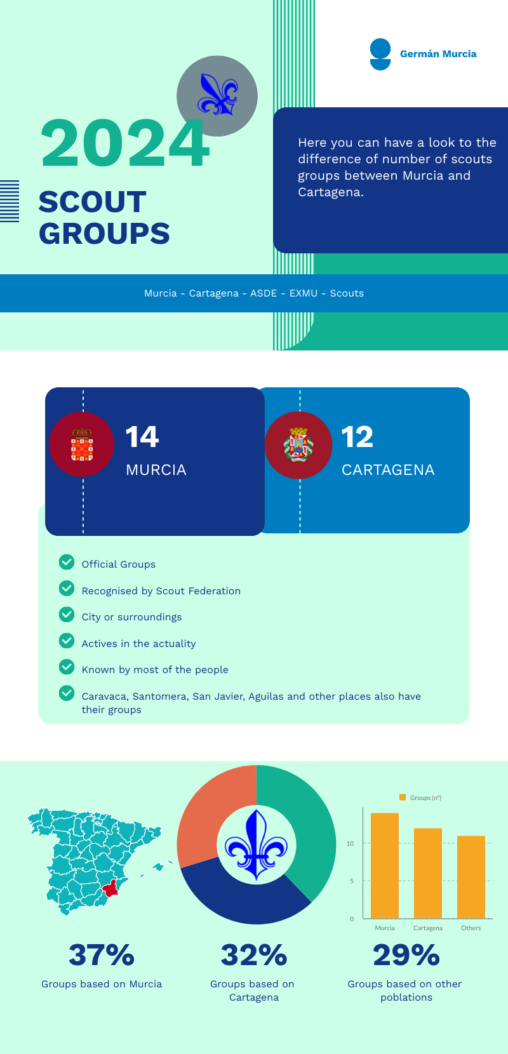
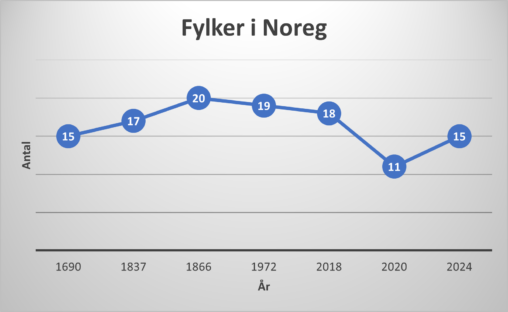
Here you can have a look to difference of number of groups in Region of Murcia, especially in the cities of Murcia and Cartagena.

There is a pie chart that represents my most listened genres since I have spotify (3 or 4 years).
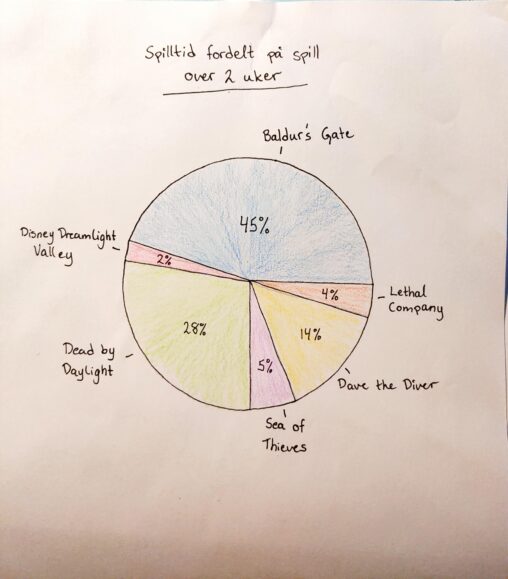
Diagrammet viser min spilltid på steam de sisto to ukene. De ulike spillene er gitt i prosent basert på hvilke spill jeg har brukt mest/minst tid på. Dataene…

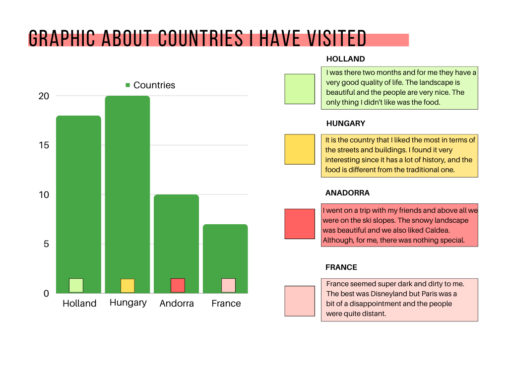
This is a graph about the countries I have visited and the reason for the score #RICT2223
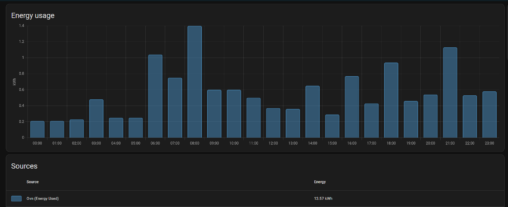
This image shows a bar graph where each bar represents 1 hour of time, and the value that the graph is showing is how much kWh my oven…
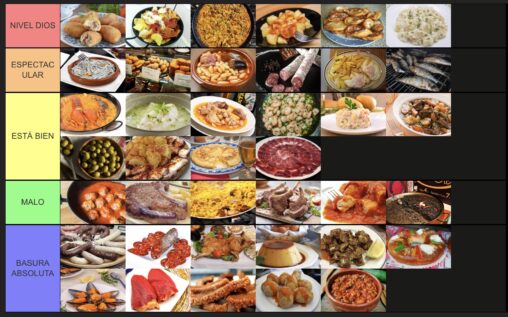
In this graphic there are classified in a subjective way some of the most famous Spanish food

In this image you can see a grafic about how much I listen to the 13 songs of the album “Crybaby” by Melanie Martinez.
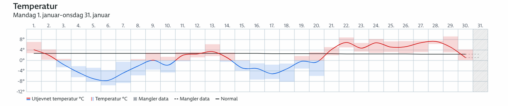
The graph shows the temperatures in Bergen for the last 30 days. Courtesy of yr.no

This graphic shows a ranking based on how much I listen to each Taylor Swift album.

Here is my music listening history for a day, sorted into the songs name, the artist, the song duration and what genre it fits into.
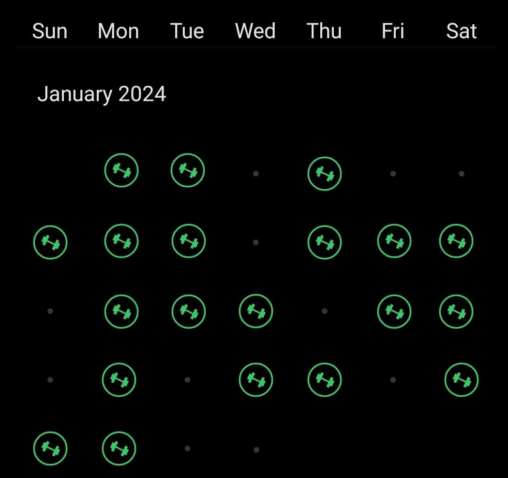
Dager i måneden jeg har hatt en 1t – 1.5t treningsøkt. Dager uten treningsøkt er hviledager eller dager hvor jeg ikke hadde mulighet til å gå på trening.

From my perspective, Oregon has landmarks that left a permanent mark on my soul during the seven years I called it home. These remarkable places not only mesmerized…

These are some of the best football teams that people fell in love with and are classified according to my criteria. 1. Barsa 2011/12 Manager: Pep Guardiola Stars:…

Data ovenfor viser til antall gjennomsnittlige skritt jeg tok i året 2023. Det er hentet fra appen “Helse” som eies av meg og blir delt med Apple Inc.