
1155 Data visualizations Categorized "18-29" (page 36 of 58)

Datavisualisering av byene jeg har bodd i etter periode, som er Oslo, Bergen, Hjørring (Danmark) og Mannheim (Tyskland).

Snøfall dager i løpet av 2023 i Oslo, NO og Bergen, NO.
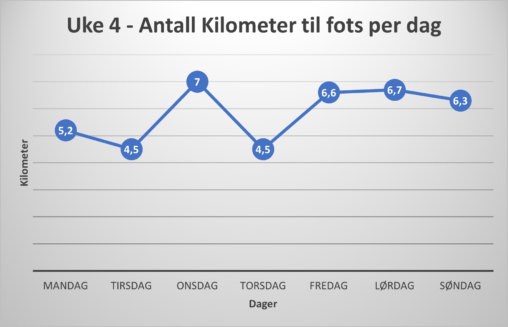
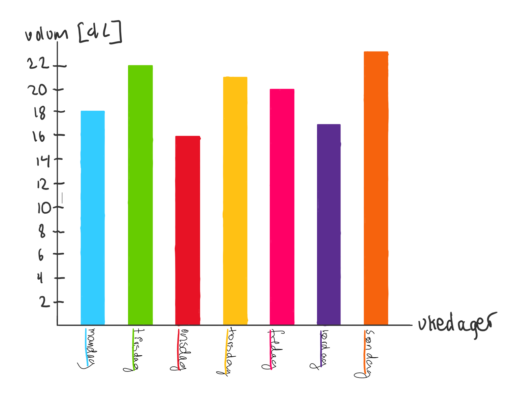
I denne grafen ser vi antall kilometer jeg har gått hver dag i Uke 4, altså 22-28 Januar. På horisontal aksen ser dagene i uken, mens på vertikal…
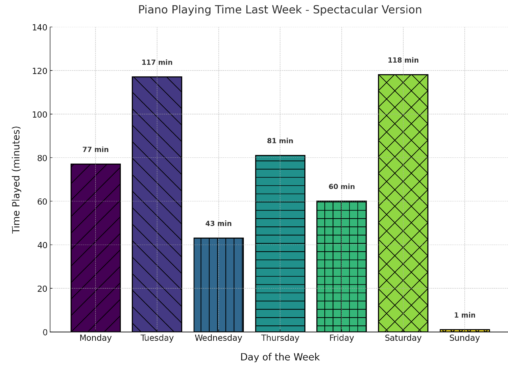
The piano playing time chart for last week. This version includes colorful bars with different patterns for each day, along with annotations displaying the exact time played in…
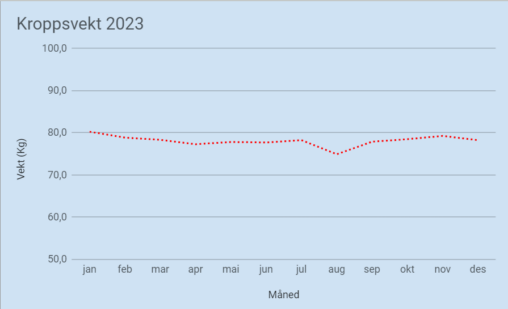
Grafen representerer den gjennomsnittlige kroppsvekten min, målt gjennom 2023. X-aksen representerer måneder og y-aksen representerer den gjennomsnittlige kroppsvekten for måneden, målt i Kg.
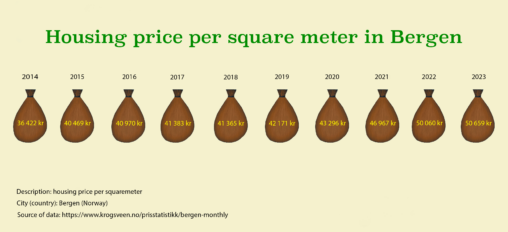
What is being shown is the housing price in Bergen per square meter from December of 2014 to December of 2023, using statistics from
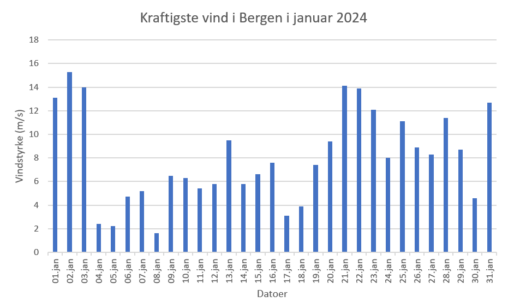
Oversikt over den kraftigste vinden i Bergen hver dag i januar 2024. Vindstyrken er oppgitt i m/s. (Laget i Excel med data fra yr.no, en tjeneste fra NRK…

Y-aksen representerer antall kilometer, og X-aksen representerer dagene i januar
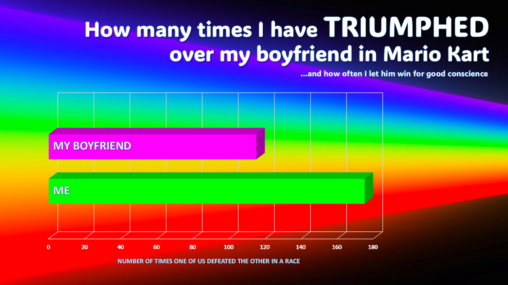
The amount of times my boyfriend and I have raced against each other in Mario Kart and one of us placed higher than the other. Numbers per race…
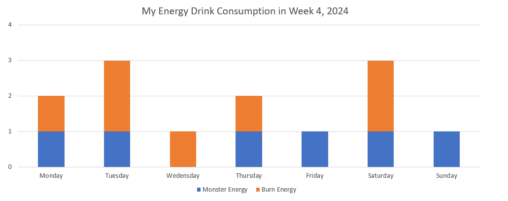
Graph represents amount of energy drinks consumed every day in week 4 of 2024. X-axis shows day of the week. Y-axis shows amount of energy drinks consumed. All…
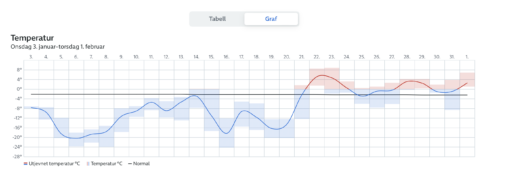
Historikk om temperaturen i hjembyen min Svelvik, Drammen Kommune. Dataen er hentet fra Yr.no. Y-aksen viser temperatur i grader celsius X-aksen viser dager, datert.
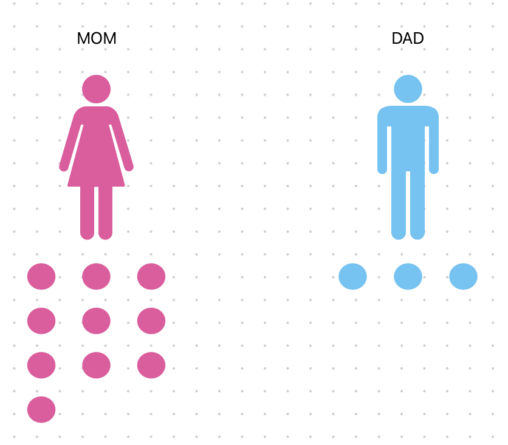
Each dot underneath mom and dad represents a familymember in the close family, and is used to represent the big difference in family size and dynamic in family…
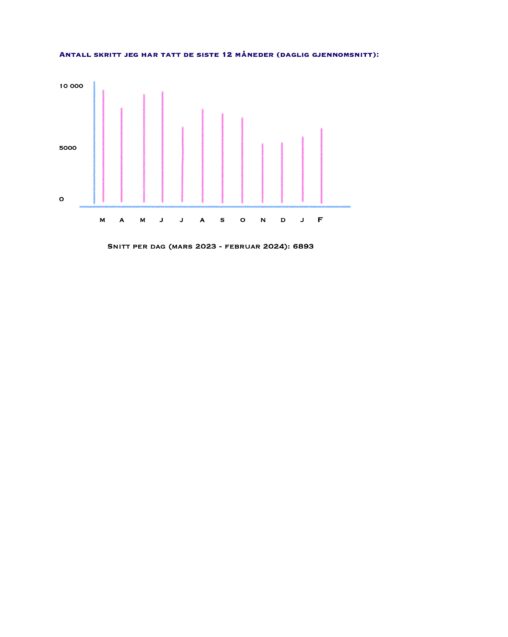
Bildet viser daglig gjennomsnitt for antall skritt jeg har tatt de siste tolv måneder. Dataen representerer månedene fra og med mars 2023 til februar 2024. Tegningen er laget…

Amount of hours spent on a plane in 2023 visualized by a cake diagram.

Skjermtid tatt fra en uke i juleferien, her vises det hvilke applikasjoner jeg benytter meg mest av i løpet av en uke.
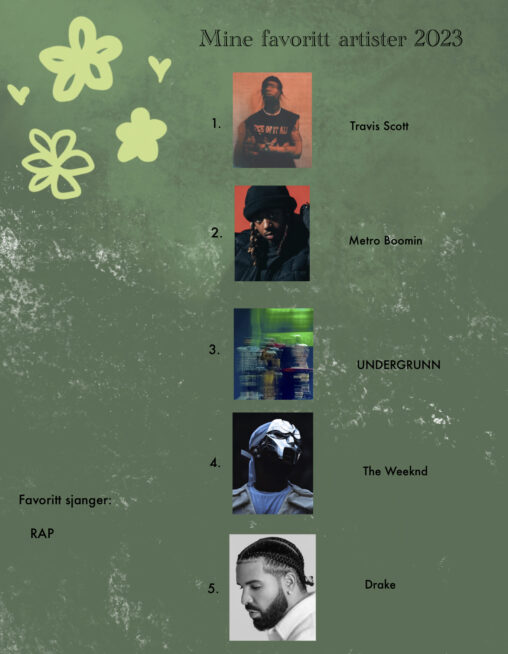
Dette er data over hvilke artister jeg har hørt mest på i 2023. Dataene er hentet fra musikk appen Spotify, som gav en oversikt over mest lyttede artister…

Diagrammet viser nedbørsdøgn i Bergen fra 2018 til 2022. Dataene er hentet fra Bergen Kommune sin nettside, hvor målingene er gjennomført av det Metrologiske institutt.
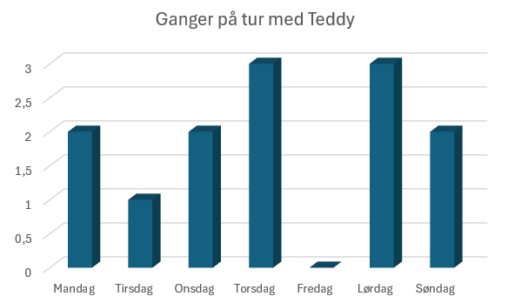
Dette er en graf som viser hvor ofte jeg var ute med min hund Teddy fra perioden 22. januar til 28. januar 2024.