1155 Data visualizations Categorized "18-29" (page 30 of 58)

Karta viser snødjubda den 1.februar for åra 2021 til 2024. Der mørkare blå farge tydar meir snø, og lysare mindre.
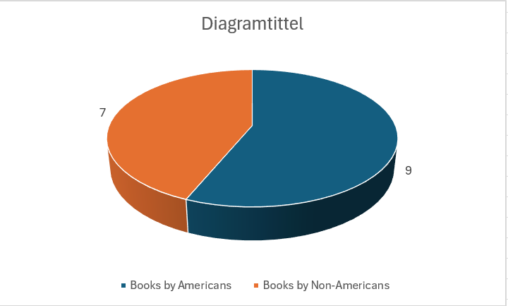
I show my data with a circle diagram. The diagram is divided into only two categories: american authors and non-american authors. The diagram shows that I have read…
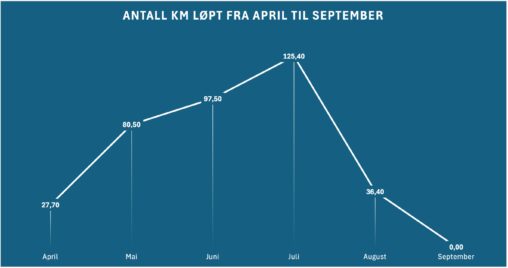
The photo visualizes personal running stats from April to September. The data is collected from my Strava account.

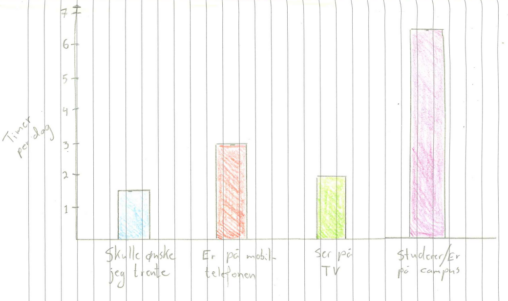
En uke med skjermtid. Visualiserer total skjermbruk hver dag, sammen med hvor lang tid jeg har brukt på mine mest brukte apper; Snapchat, TikTok og Candy Crush.
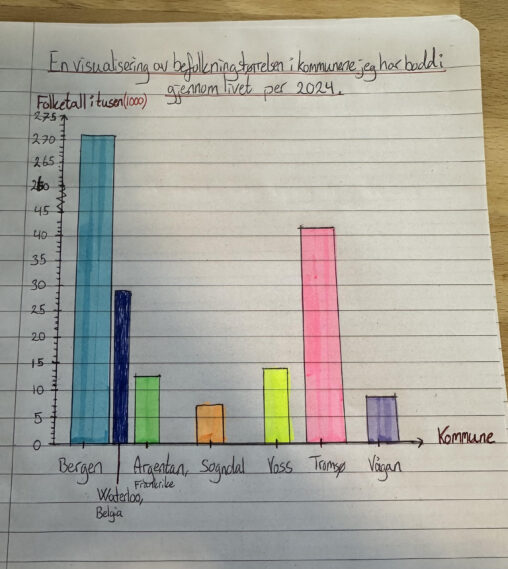
Dataen viser antall folketall/innbyggertall i de ulike kommunene.
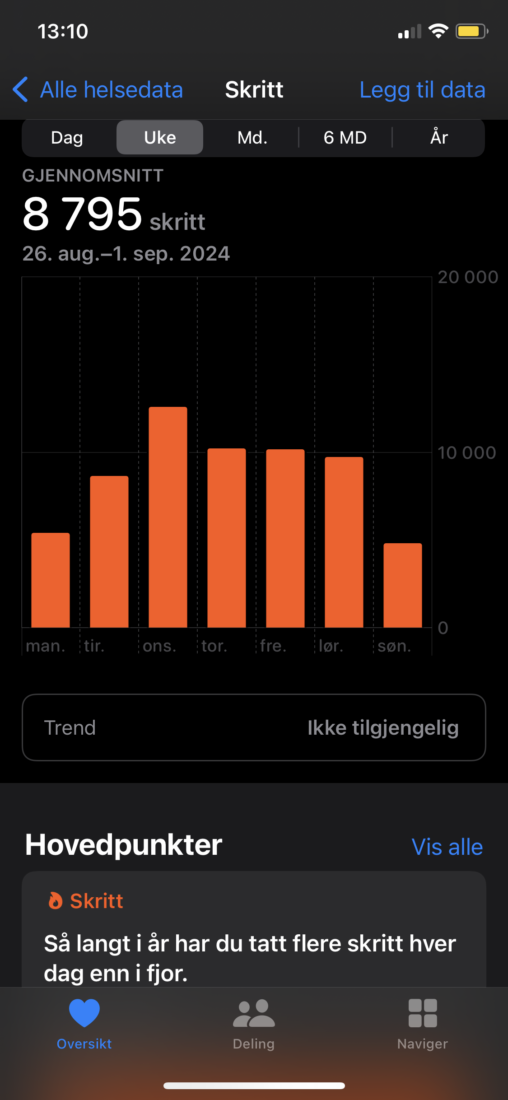
Columns representing my steps every day from aug 26th to sep 1st 2024 (week 35), including the average daily steps in that week.

Tabellen viser antall hjort som har blitt felt under hjortejakten i Ørsta de siste årene. Offentlig domene Møre-nytt
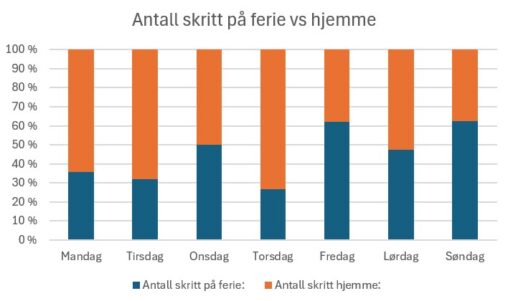
I denne dataen sammenligner jeg antall skritt daglig på ferie med når jeg er hjemme. Diagrammet viser en prosentvis fordeling mellom skrittene. Ferieperioden er 19.08 – 25.08, mens…
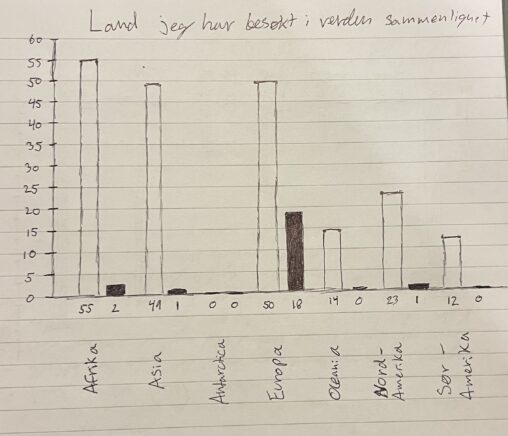
I grafen representeres antall land i hvert kontinent med søylen til venstre, og antall land jeg har besøkt i hvert kontinent med søylen til høyre. Kontinentene er sortert…
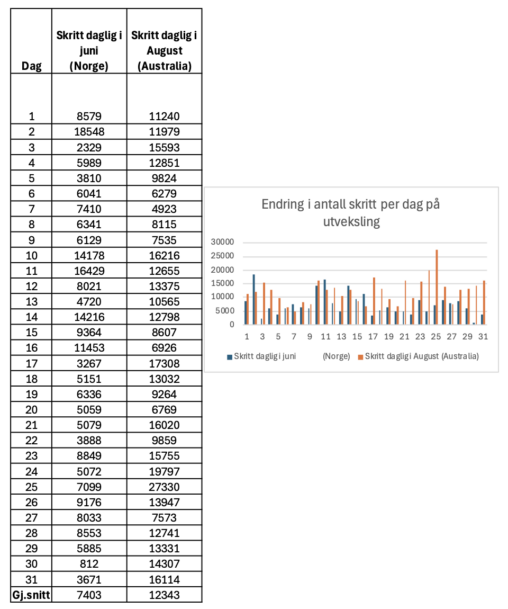
Sammenligner antall skritt daglig hver dag i juni, før jeg dro på utveklsing med antall skritt daglig i august mens jeg er på utveksling. Data er hentet fra…

The data is from Bergen kommune (https://www.bergen.kommune.no/omkommunen/fakta-om-bergen/klima/tall-som-beskriver-klima-i-bergen). They have recieved the data from Meteorologisk institutt, Florida målestasjon. The figure shows the difference between rainy days in Bergen in…
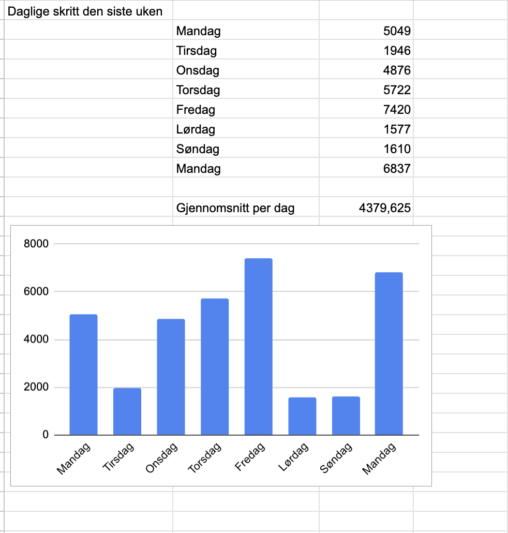
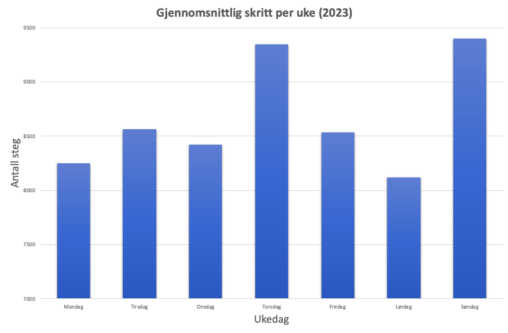
Dataen er hentet fra helse-appen på iPhone. Her har mobilen samlet inn data over hvor mange skritt per dag jeg går (forutsett at mobilen er med meg). Dette…
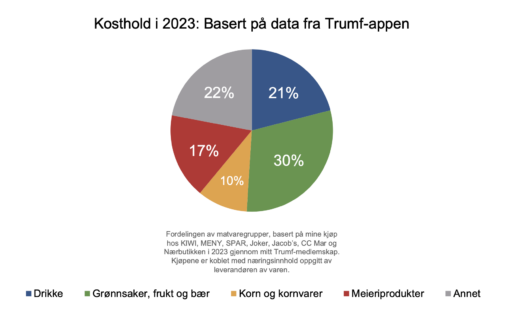
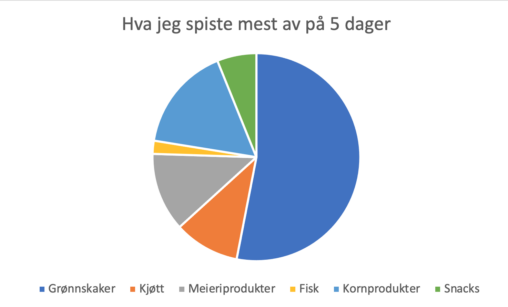
Fordelingen av matvaregrupper, basert på mine kjøp hos KIWI, MENY, SPAR, Joker, Jacob’s, CC Mar og Nærbutikken i 2023 gjennom mitt Trumf-medlemskap. Kjøpene er koblet med næringsinnhold oppgitt…
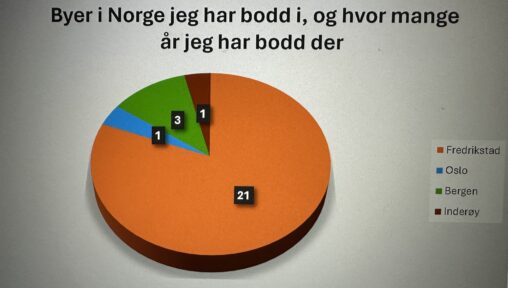
Dette diagrammet viser ulike byer i Norge jeg har bodd i i løpet av mitt 26 år lange liv, og hvor mange år jeg har bodd i hver…
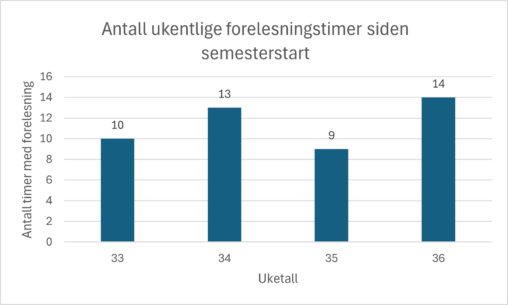
X-aksen representerer ukenummer fra dette semesteret startet, mens y-aksen representerer antall uker med forelesning jeg hadde i hver av disse ukene.