
1155 Data visualizations Categorized "18-29" (page 29 of 58)

Visualiseringen representerer antall skritt jeg har gått hver dag i uke 36
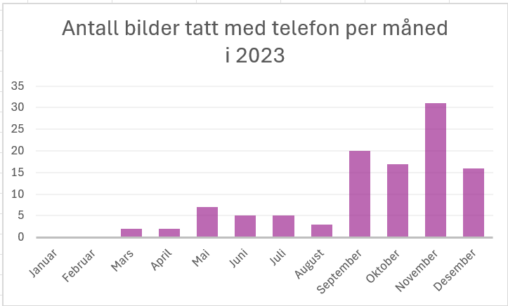
I grafen visualiseres antall bilder tatt per måned av meg med telefon i året 2023. Alle disse bildene fant jeg på bilde appen på telefonen.

Dette er hvor mange timer jeg har brukt på telefonen sist uke (uke 36). Visualiseringen er laget i excel.

I data visualiseringen ser man hvor mange nedbørs dager det var i Bergen per måned for året 2023. Langs x-aksen står månedene og langs y-aksen er antall nedbørs…

Here’s a pie chart illustrating how time is distributed across different apps during a typical day. Each colored segment represents the minutes spent on a specific app, providing…
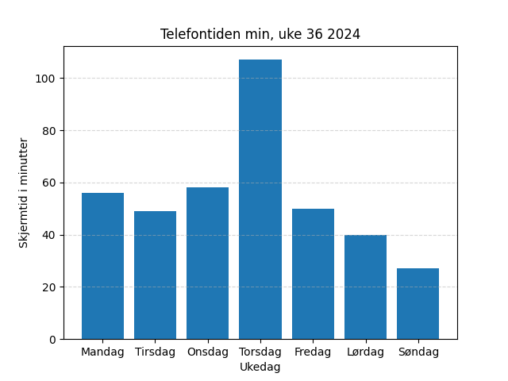
A simple visualization of mobile screen time in minutes (y-axis) per day of the week (x-axis) in a week in 2024. My own data. Public Domain.
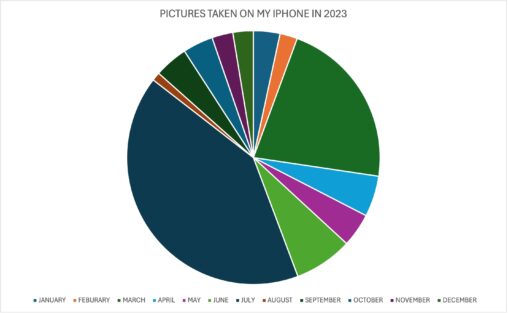
The number of pictures I have taken with my iPhone during each month of 2023. The two outlying months are March and July, this is due to me…

Hvor mange skritt jeg har gått i gjennomsnitt per dag i august måned hvert år siden 2019.
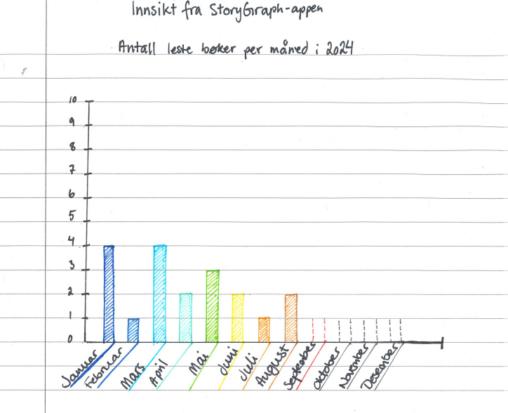
Antall bøker jeg leste i 2024, per måned. Data for september til desember er estimert, da statistikken tilsier at det vil bli lest minst en bok for hver…

Dette er data på hvor mange skritt jeg gikk hver av dagene i uke 36. Dataen er registrert av appen “Helse” på iPhone. Visualiseringen er laget i Excel.
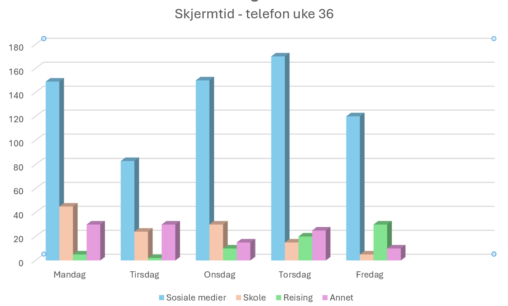
Skjermtid på telefonen fordelt i ulike kategorier i hverdagen uke 36. Mandag – fredag hadde jeg i snitt 3 timer og 55 minutter med skjermtid på telefonen. Disse…
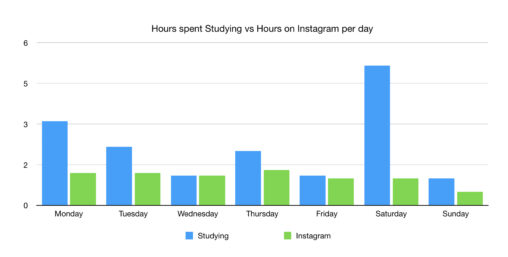
The data is taken from this past week. Time studying and time on Instagram each day is being represented.
her viser bildet antall timer søvn per dag i et tidspann på en uke.
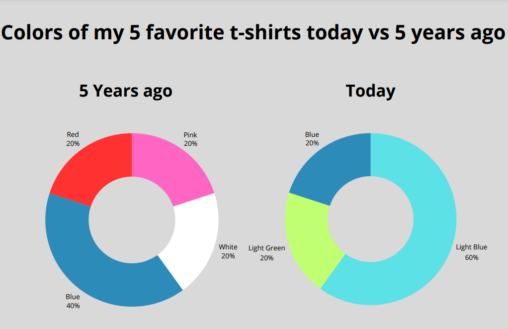
The colors you wear can say something about who you are. Here are the colors of my 5 favorite t-shirts today and 5 years ago.
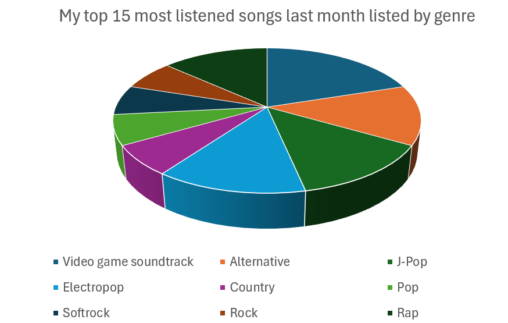
This image shows what genres I listened to the most last month.

Denne dataen visualiserer hvor mange timer jeg brukte på mobiltelefonen min i uke 36. Nærmere så visualiserer daten hvilke apper som ble mest brukt denne uken. Dette var…
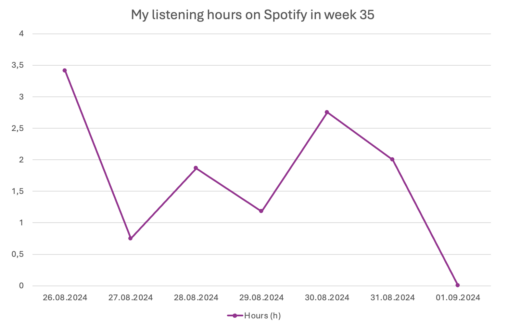
This is an overview of my listening hours on Spotify in week 35 with my headphones. Mean exposure is 65 dB.
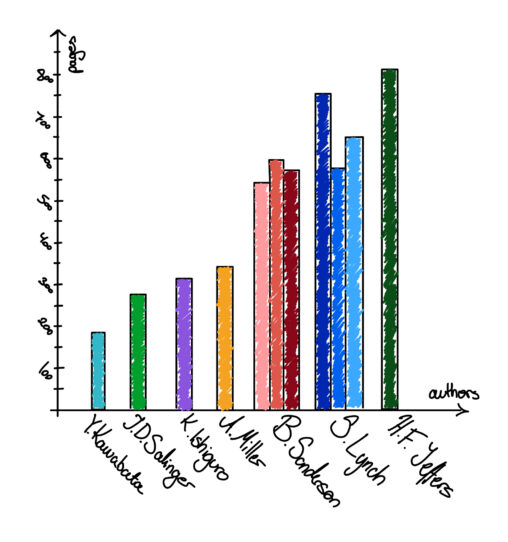
Timeframe: 1st of January 2022 until now Book(s) read by author sorted by average page number for the data subsets. Comics, novellas and other similar texts with <100…
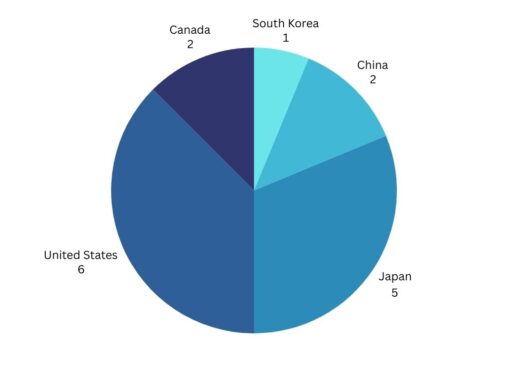
A pie chart detailing the games I played in 2023 by country of origin. Country of origin is here defined as the country in which the majority of…
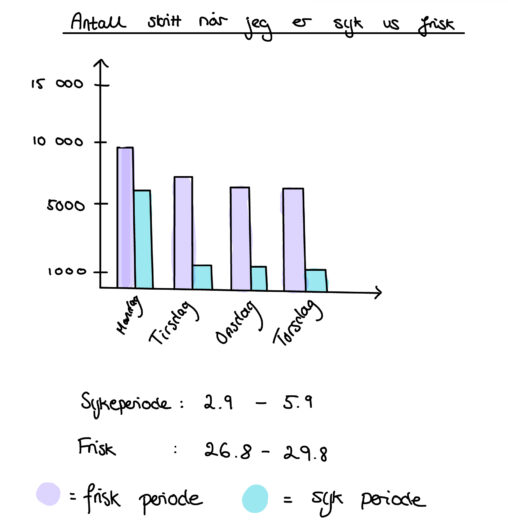
Bildet viser antall skritt jeg har gått når jeg var frisk i uke 35 og når jeg var syk i uke 36. Frisk periode vises med lilla og…