
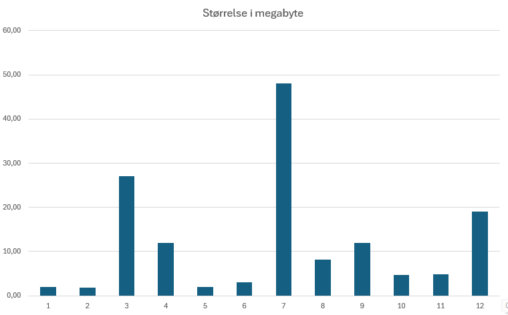
1155 Data visualizations Categorized "18-29" (page 22 of 58)
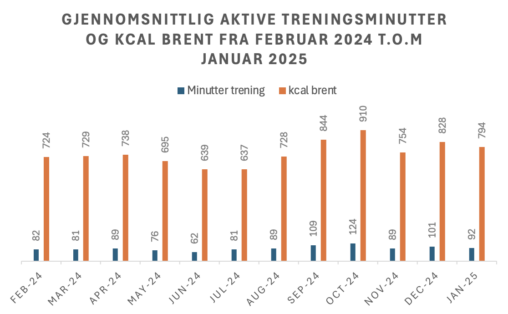
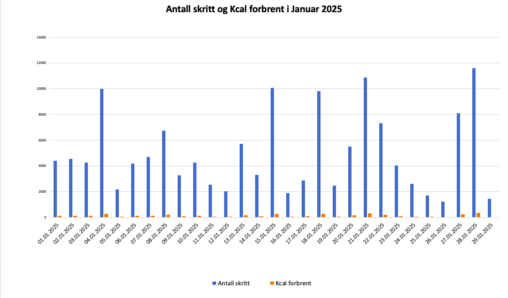
gjennomsnittlig aktive treningsminutter og kcal brent fra februar 2024 t.o.m januar 2025.
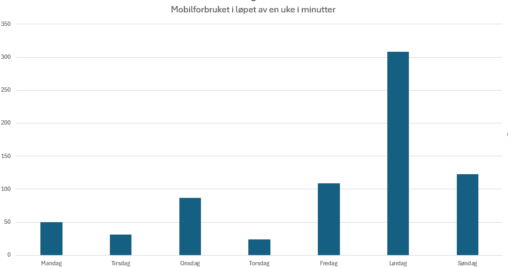
This bar chart illustrates mobile phone usage throughout a week in minutes. Each bar represents the total duration of mobile usage (in minutes) for each day of the…
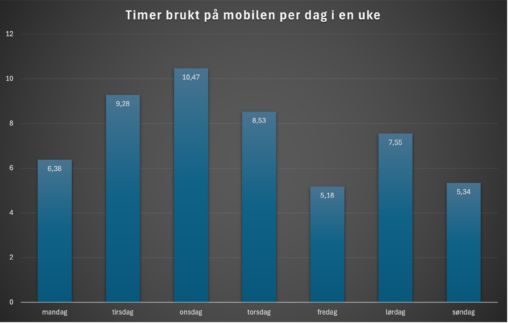
Dette diagrammet representerer hvor mange timer per dag, i løpet av en uke brukt på mobilen.
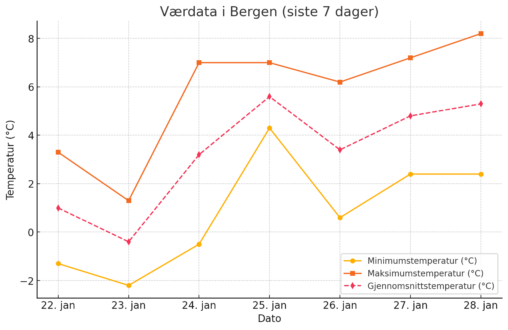
Jeg har valgt å bruke et linjediagram fordi det viser tydelig hvordan temperaturen har variert over tid. Jeg bor i Bergen og har derfor nytte av denne dataen…
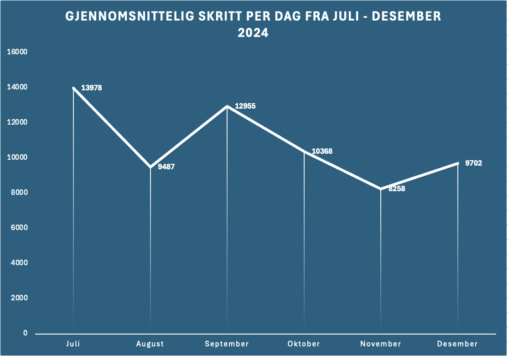
Linjediagrammet viser hvor mange skritt jeg har gått i gjennomsnitt hver dag i måneden. Jeg har valgt å vise fra Juli til Desember.
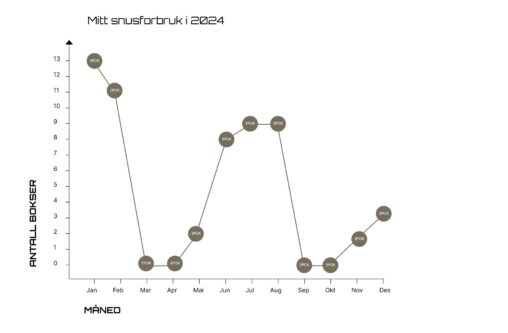
Linjediagrammet representerer hvor mange snusbokser jeg har kjøpt hver måned i løpet av 2025.
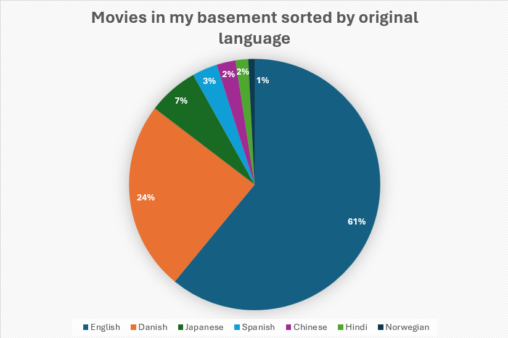
The exact amount of movies per language: English:75 Danish: 30 Japanese:8 Spanish:4 Chinese:3 Hindi:2 Norwegian:1

Dette stolpediagrammet representerer hvor mange minutter per dag, i løpet av en uke, jeg tilbringer på TikTok.
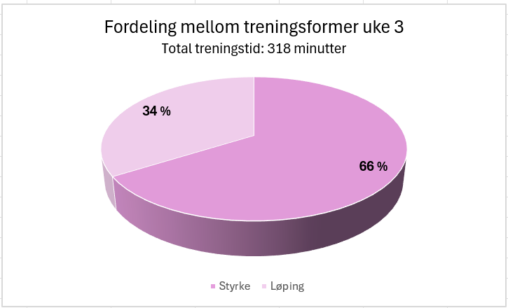
Visualiseringen representerer den prosentvise fordelingen mellom treningsformene løping og styrketrening i uke 3, 2025. Dataene er presentert i et kakediagram der prosentene for hver treningsform er summen av…
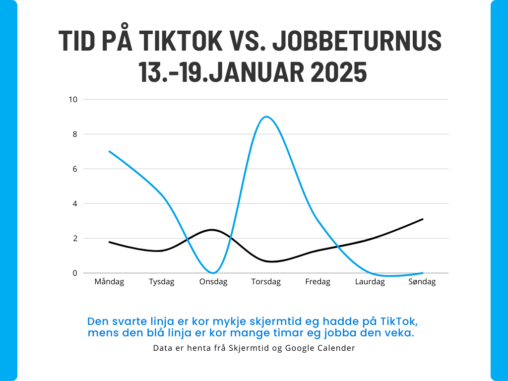
Diagrammet viser antall timer brukt på tiktok og på jobb i perioden 13.-19.januar. Enhetsformen som er brukt er timer, og den blå grafen viser arbeidstimar medan den svarte…

Diagrammet viser antall timer brukt på å lese i fem ulike emner ved UiB i perioden 1. januar til og med 28. januar. Enhetsformen brukt er timer. Diagrammet…
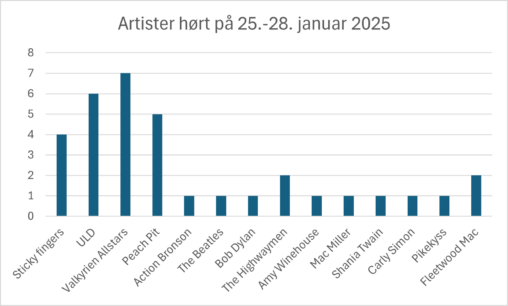
Oversikt over antall ganger ulike artister har blitt spilt i perioden 25.-28. januar 2025
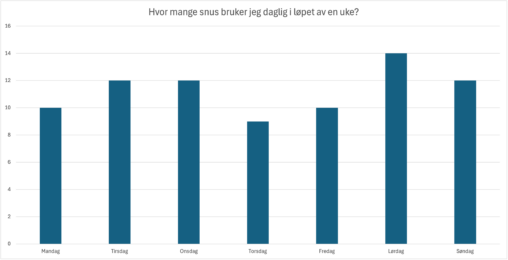
Diagrammet viser hvor mange snus jeg bruker i løpet av dagen, hver dag i løpet av en uke (uke 4 i 2025). Y-akse viser antall snus og X-aksen…
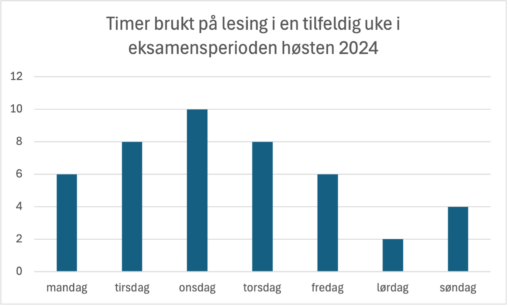
Diagrammet viser en oversikt over antall timer brukt på lesing hver dag i en tilfeldig uke under eksamensperioden høsten 2024. Stolpediagrammet er laget i excel. Y-aksen viser antall…
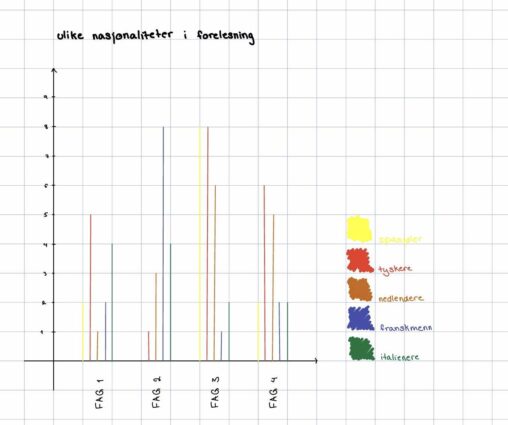
Dataene viser hvor mange fra ulike land som er i de forskjellige forelesningene mine på utveksling. Hver farge representerer ulike nasjonaliteter.

Dataene er hentet fra volleyballaget mitt sitt oppmøte på trening de tre første ukene i januar, for hver ukedag. Det er appen Spond som har gitt meg dataene.