1154 Data visualizations Categorized "18-29" (page 2 of 58)
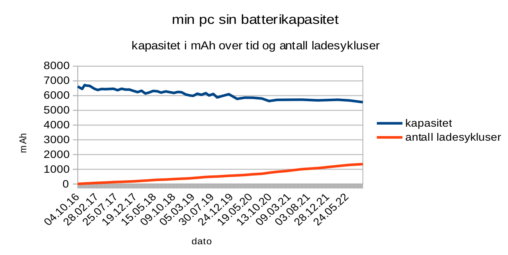
Utviklingen i min pc sin batterikapasitet fra den var ny over en bruksperiode av over flere år og 1200+ ladesykluser. Jeg eier dataene og har brukt LibreOffice til…
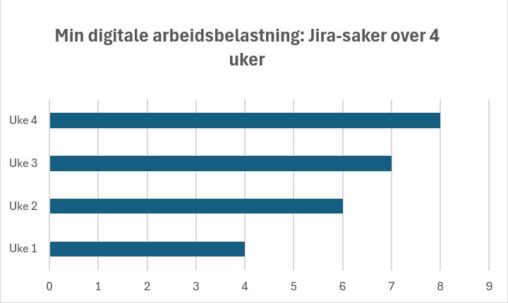
Jeg valgte å visualisere antall Jira-saker per uke fordi dette representerer min digitale arbeidsbelastning. Økningen fra uke 1 til uke 3 viser en tydelig intensivering av arbeidsmengde, før…
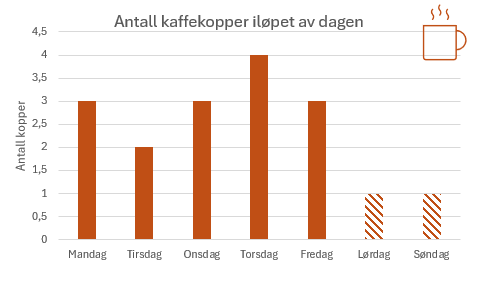
Diagrammet viser antall kaffekopper jeg drikker i løpet av en vanlig uke, fordelt per ukedag (mandag til søndag). Eget arbeid
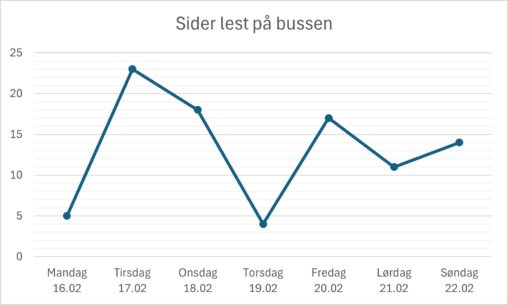
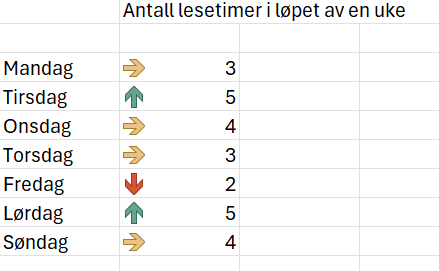
Jeg samlet data på hvor mange sider jeg leste av “Wuthering Heights” av Emily Brönte på bussen i løpet av en uke. Noen dager var det mer kø…
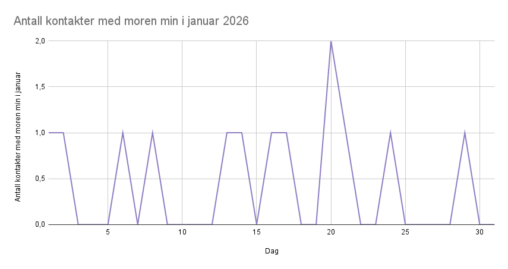
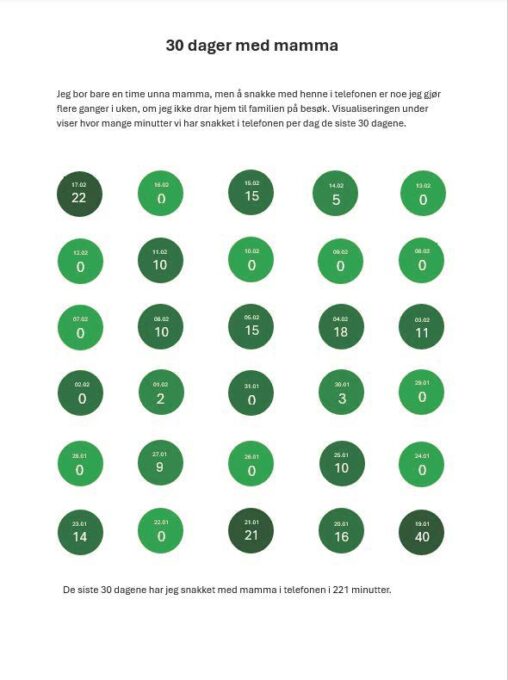
Jeg ville vite hvor ofte jeg ville ringe moren min, som bor i et annet land, i januar 2026.

Jeg ville vite hvor ofte jeg ville ringe moren min, som bor i et annet land, i januar 2026.
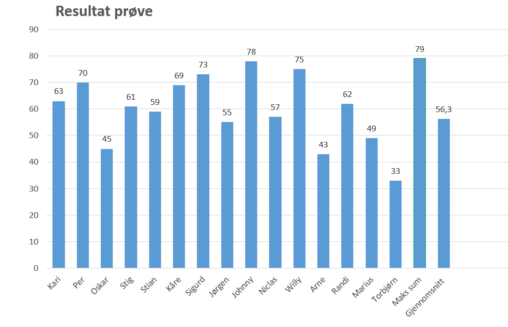
Ved å lage søylediagram er det lettare å sjå resultata fordelt på kvar elev. Ein ser bedre kor mange som er på dei ulike nivåa. Her er eg…
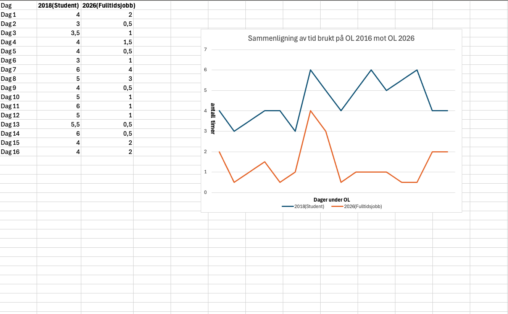
This visualization shows an approximate comparison of the number of hours I spent watching the 2018 and 2026 Olympic Games, measured in hours for each edition of the…
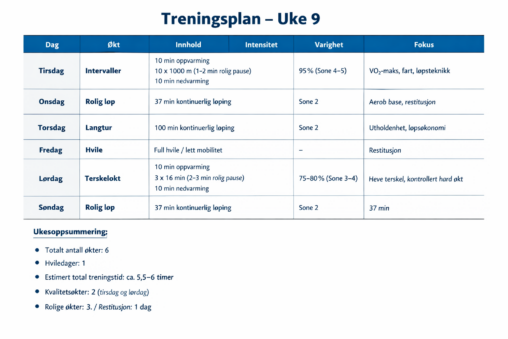
Her har jeg lagt data inn i chat gpt angående en treningsuke jeg har hatt. Jeg skrev dette inn for å få den til å visualisere dataene inn…
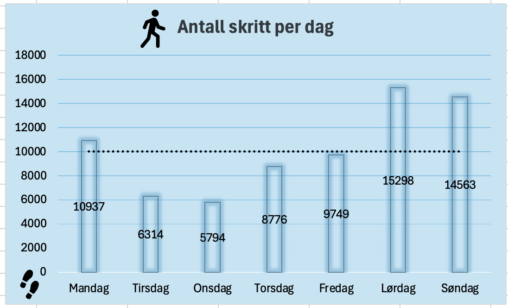
Diagram laget i excel over antall skritt i uken målt opp mot 10.000 som mål med visualisering av hvilke dager som ligger over og under målet
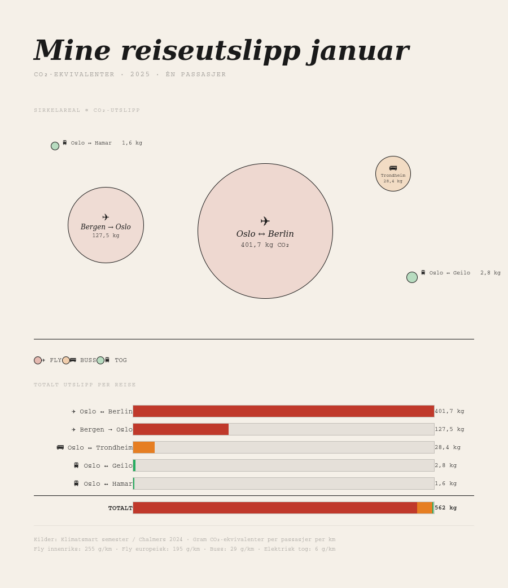
This visualization shows my personal CO₂ emissions from five trips taken in January 2025. Each journey is represented by a proportional circle (where the area corresponds to the…
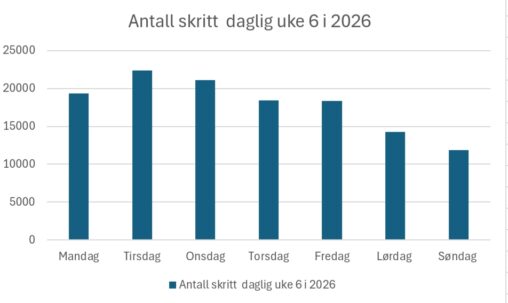
Her er en oversikt over antall skritt eg hadde daglig i uke 6 i 2026. Data er samlet inn via en Garmin pulsklokke og Garmin sin Collect app.
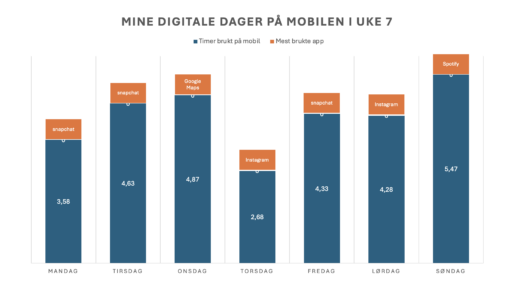
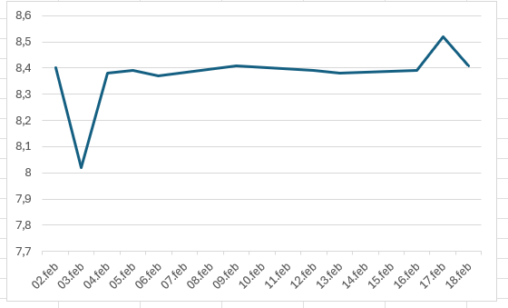
Denne visualiseringen representerer min personlige skjermtid over en sammenhengende syv-dagers periode, fra Mandag 9. februar til Søndag 15.februar 2026. Dataene er delt opp per dag og viser to…
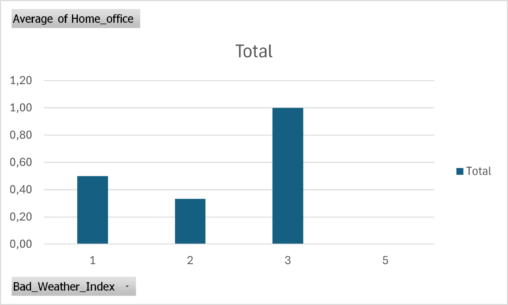
Pivot-table showing the number of home office days compared to a bad weather index that I calculated using data from Yr.no.
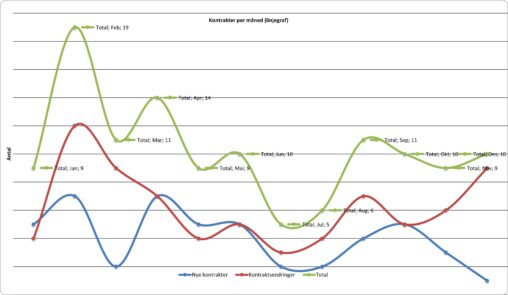
Grafen viser månedlig kontraktsaktivitet fordelt på inngåelse og signering av nye kontrakter, kontraktsendringer og total aktivitet. Totalt volum drives både av nye kontrakter og endringer, som følger et…
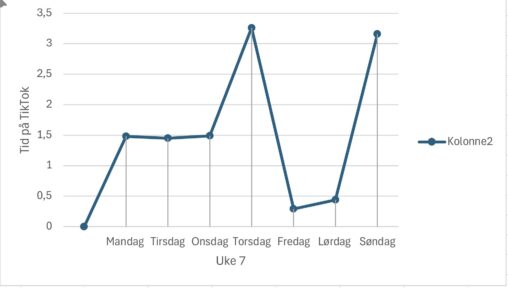
Dette er en observasjon på hvor mye skjermtid, jeg som 19 år gammel jente bruker på TikTok. Har gjort dette gjennom en uke, ved å bruke skjermtid appen.