
1155 Data visualizations Categorized "18-29" (page 15 of 58)
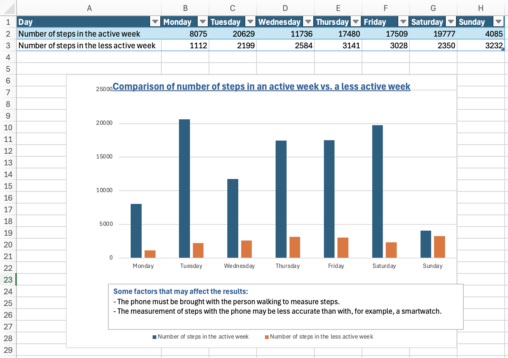
In this diagram I have presented the amount of steps taken in an active week, compared to a less active week. I have collected information from the health-app…
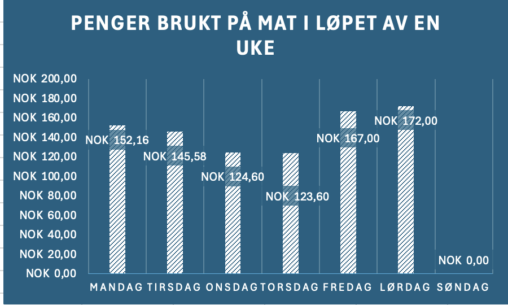
Her har jeg lagt inn mitt ukentlige forbruk på mat som student i en vanlig uke.
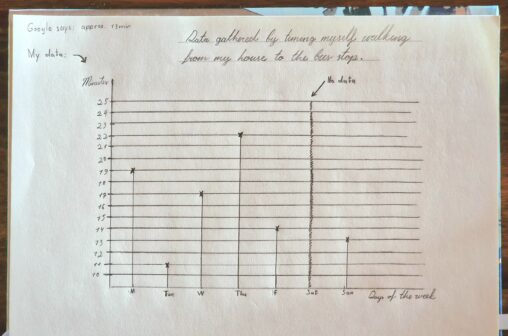
This is a visualization of the data I gathered by timing myself walking from my home to my bus stop and comparing it to the approximate time that…
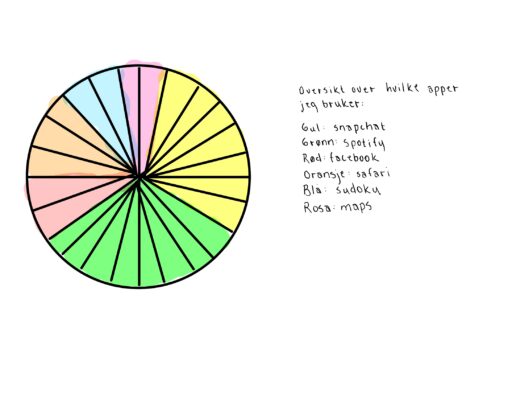
Det er presentert et sirkeldiagram med hvilke apper jeg bruker på telefonen. Sirkeldiagrammet tilsvarer en dag.

Med kjøkkenredskaper menes det f.eks. tallerken, bestikk, kjeler, ostehøvel, kopper, osv. Jeg har ikke oppvaskmaskin så alt vaskes for hånd. Dersom det ikke er mye å vaske, f.eks….
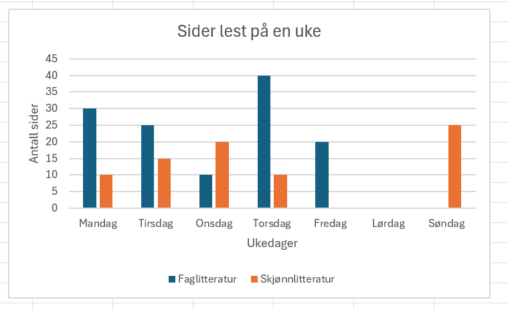
Antall sider som jeg har lest på en uke, fordelt på faglitteratur og skjønnlitteratur og vist per dag. Faglitteratur = blå og Skjønnlitteratur = oransje
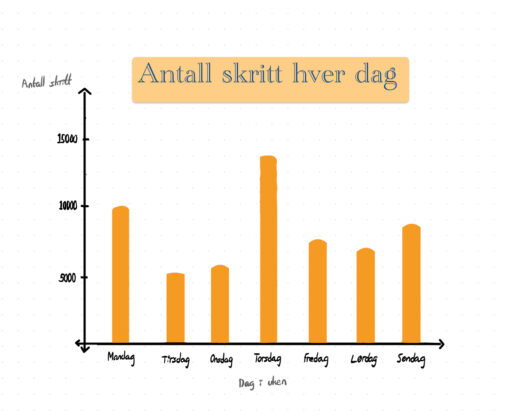
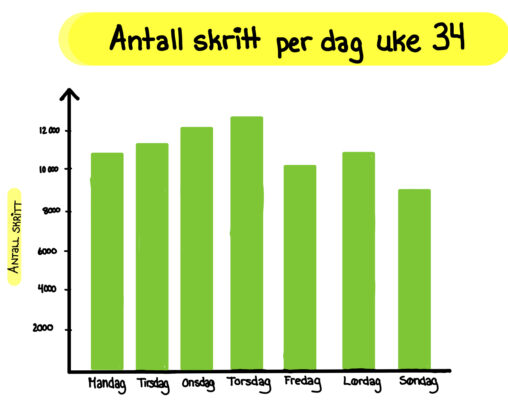
Grafen viser hvor mye jeg gikk hver dag i en uke, med ukedagene i X-aksen og antall skritt i Y-aksen.
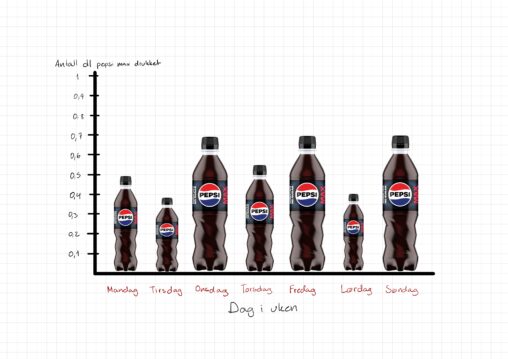
Hvor mye Pepsi max som er drukket, målt i dl, fra Mandag til Søndag. Dataene er mine egne.
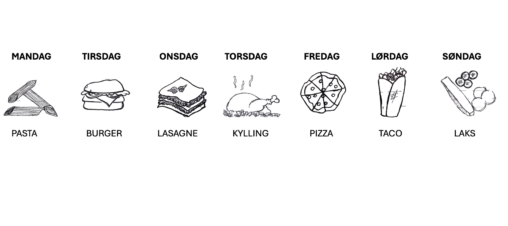
En tabell som går fra mandag til søndag med illustrasjoner og beskrivelser av matretter for hele uken.
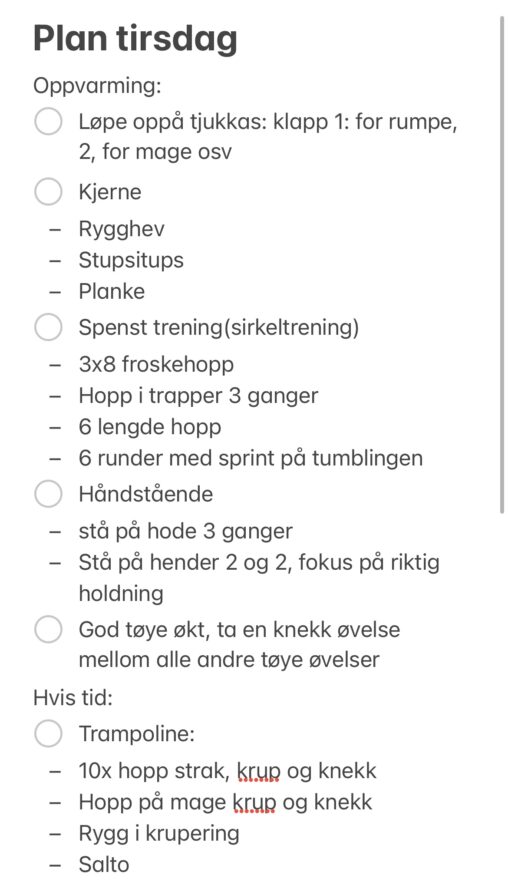
Bildet beskriver en treningsplan for stupere. Treningen starter med en rask oppvarming på tjukkas og deretter kjerne og spenst trening. Samt videre til håndstående og tøying. Etter dette…
Kilden til disse dataene er mine egne personlige dokumenter. derfor er de min eiendom og er ikke beskyttet av opphavsrett.
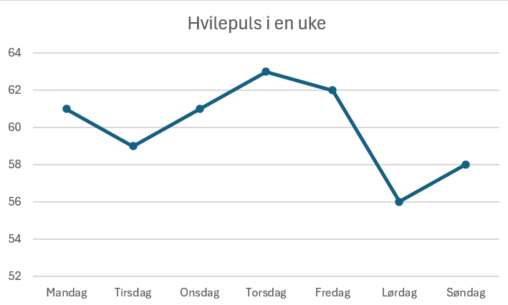
I have used Excel to represent my data. The data is my average resting heart rate in a week, measured from my smart-watch. The horisontal axis represent the…
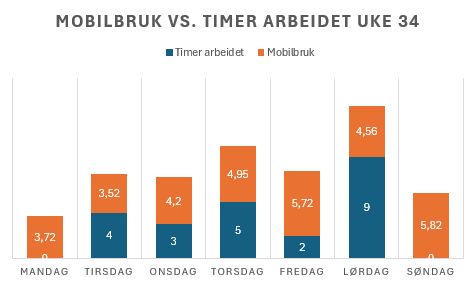
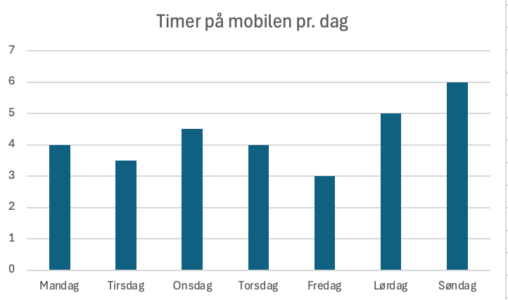
Søylediagram som viser antall timer arbeidet og brukt på mobilen i uke 34 per dag. Dataene er hentet fra min egen kalender og skjermtidstatistikken på min Samsung-mobil. Det…
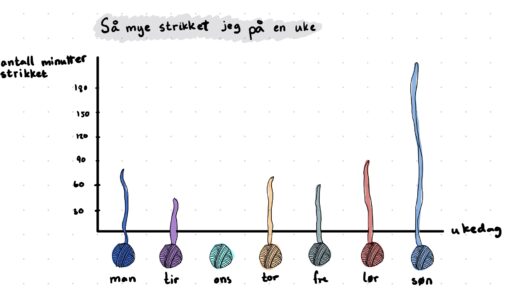
Dette søylediagrammet viser hvor mange minutter jeg har strikket i løpet av en uke der søylene er byttet med utdradde garnnøster
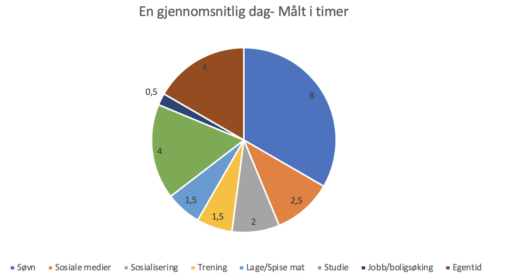
Viser hvordan en vanlig dag i mitt liv ser ut. Tallene representerer timer og viser til et helt døgn.
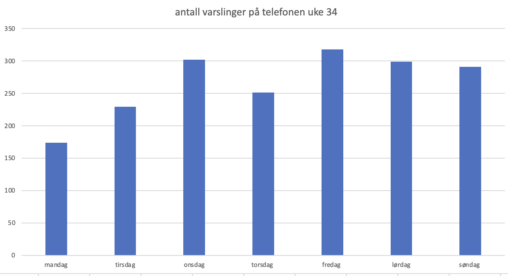
viser antall ganger mobilen min fikk en varsling hver dag i løpet av en uke. Uke 34 blir brukt for datainnhentingen og ble funnet på min Iphone sin…
Jeg lagde en oversikt over min skjermtid på mobilen i løpet av en tilfeldig uke. Dataen fant jeg på mobilen min, men la dette inn i Excel for…
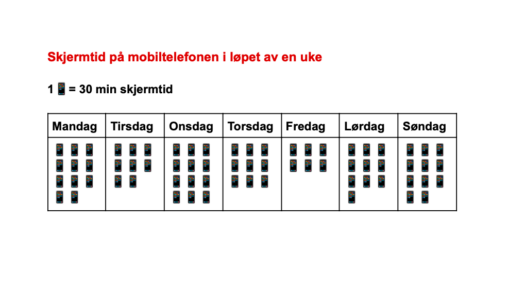
I denne oppgaven har jeg valgt å lage en visualisering av hvor mye skjermtid jeg har på mobiltelefonen i løpet av en uke. For å gjennomføre oppgaven har…