
1155 Data visualizations Categorized "18-29" (page 13 of 58)
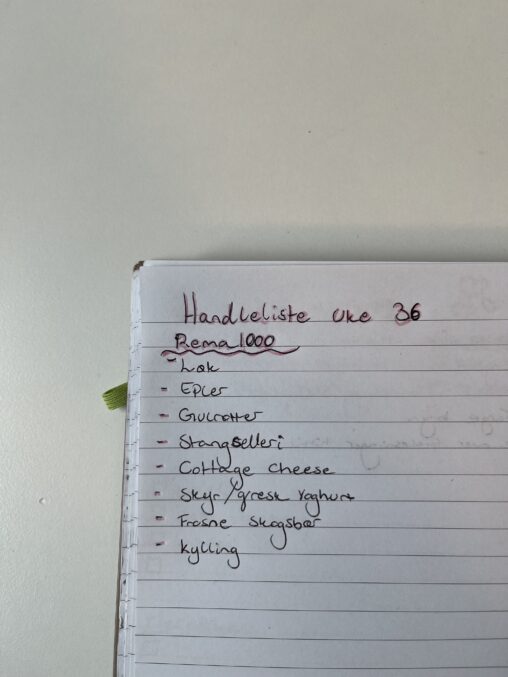
En handleliste for mat jeg skulle handle på rema1000 i uke 36. Copyright status: Creative Commons licence. Eieren av dataen: Meg selv
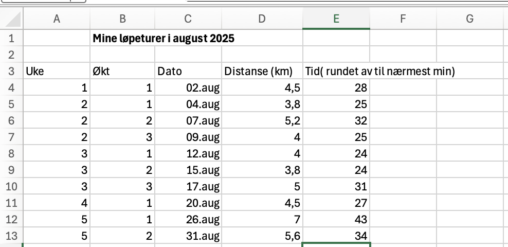
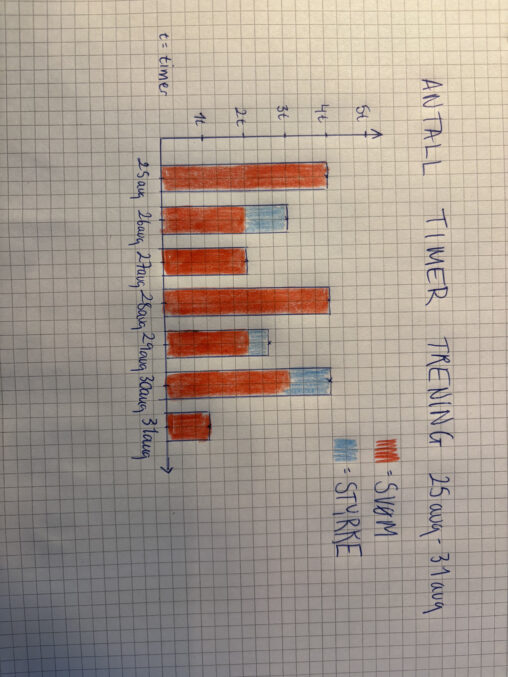
Denne tabellen viser mine egne treningsdata over en periode på 1 måned. Eg har registrert distanse i km og hvor lang tid eg brukte på hver økt. Dataene…
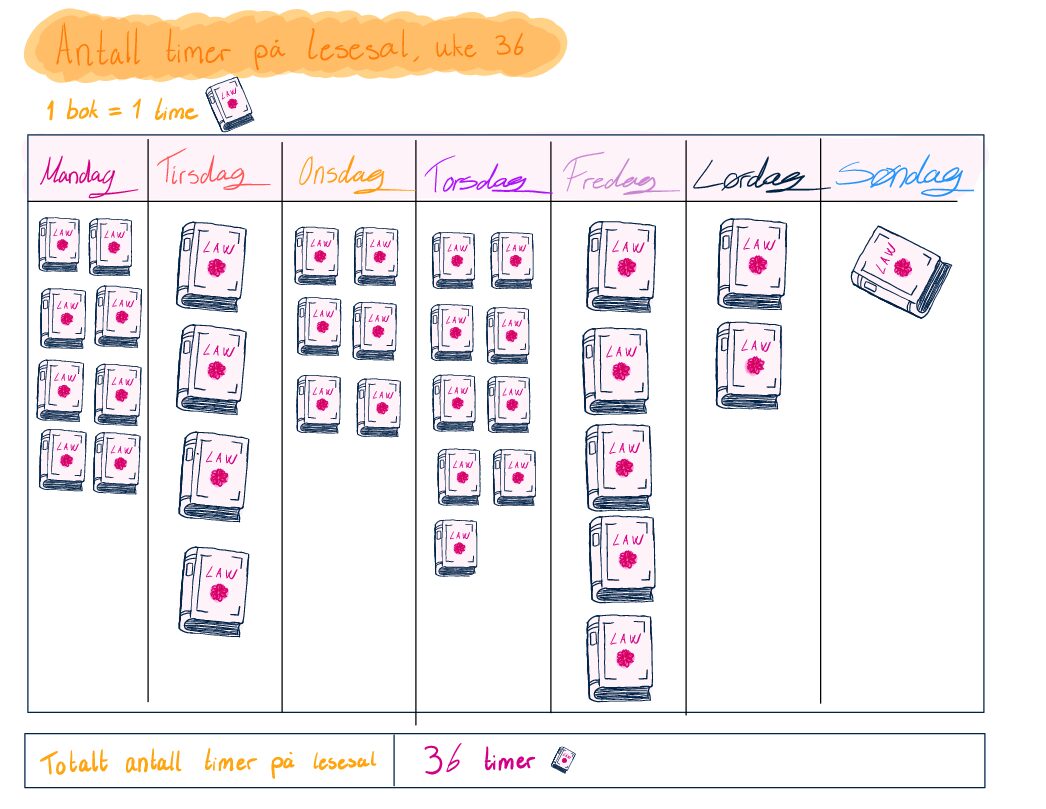
Her er en fremstilling av hvor mange timer jeg brukte i uke 36 på lesesal som jusstudent.
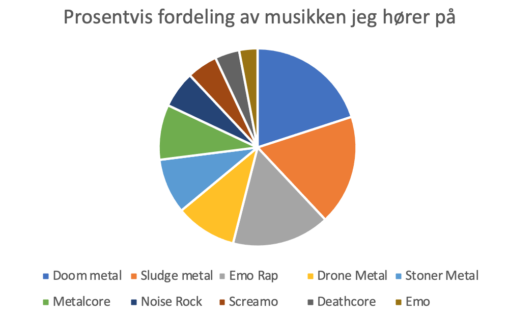
Dataen er fordelt prosentvis via et sirkeldiagram. Dataen er funnet på statsforspotify.com som har brukt data fra spotify.
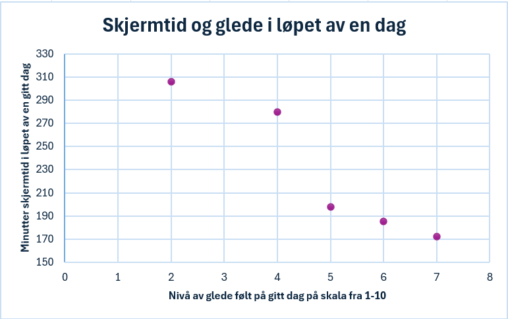
Jeg loggførte skjermtiden min i løpet av en uke og plottet det mot hvor glad jeg hadde vært samme dag. Dataene er mine egne personlige

This photo was taken on a trip to Oslo when i was in hight school. I was taking photography for an extra course and it was something i…
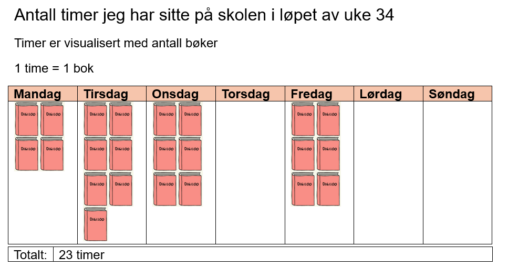
Tabell som gir oversikt over uke 34, når jeg var på skolen og hvor mange timer jeg satt der.
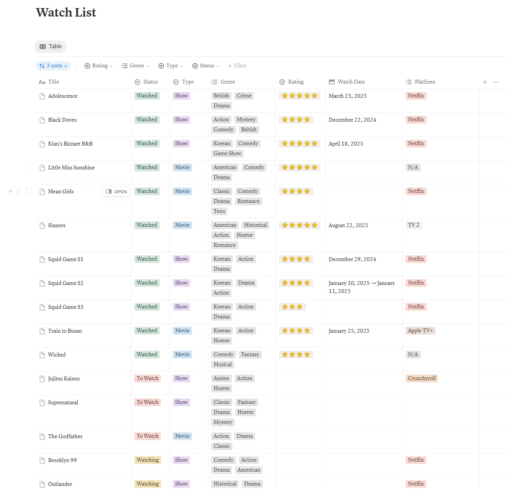
En tabell over filmer og serier jeg har sett, kategorisert etter dersom de er sett/usett, sjanger, hvilken rating jeg gav, osv.
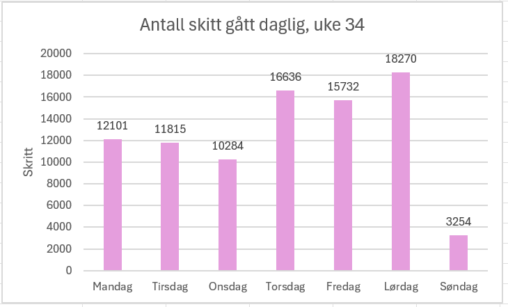
Antall skritt jeg gikk i uke 34. Skrittene er målt med appen Helse på iPhone 16. Visualiseringen er gjort med Excel.
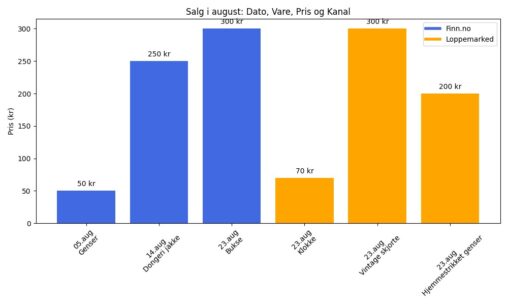
Oversikt over salg av ting fra Finn.no og Loppemarked for august måned (oppdatert)
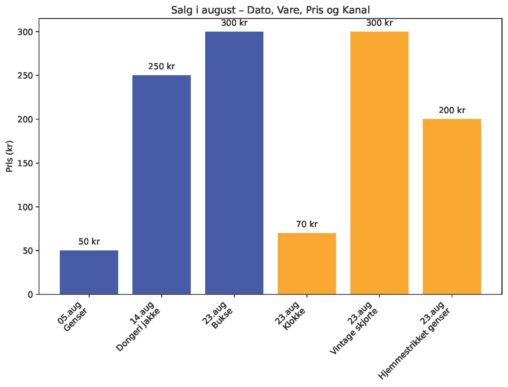
Oversikt over salg av egne ting fra Finn.no og Loppemarked for august måned.
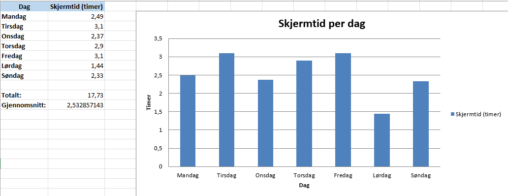
En oversikt over skjermtid brukt på min mobiltelfon over uke 35. Visualiseringen er gjort gjennom microsoft excel og dataene som er brukt er mine egne.
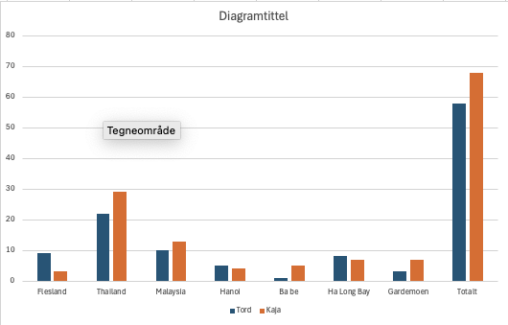
En presentasjon av antall seire i kortspill mellom meg og min kone på vår bryllupsreise
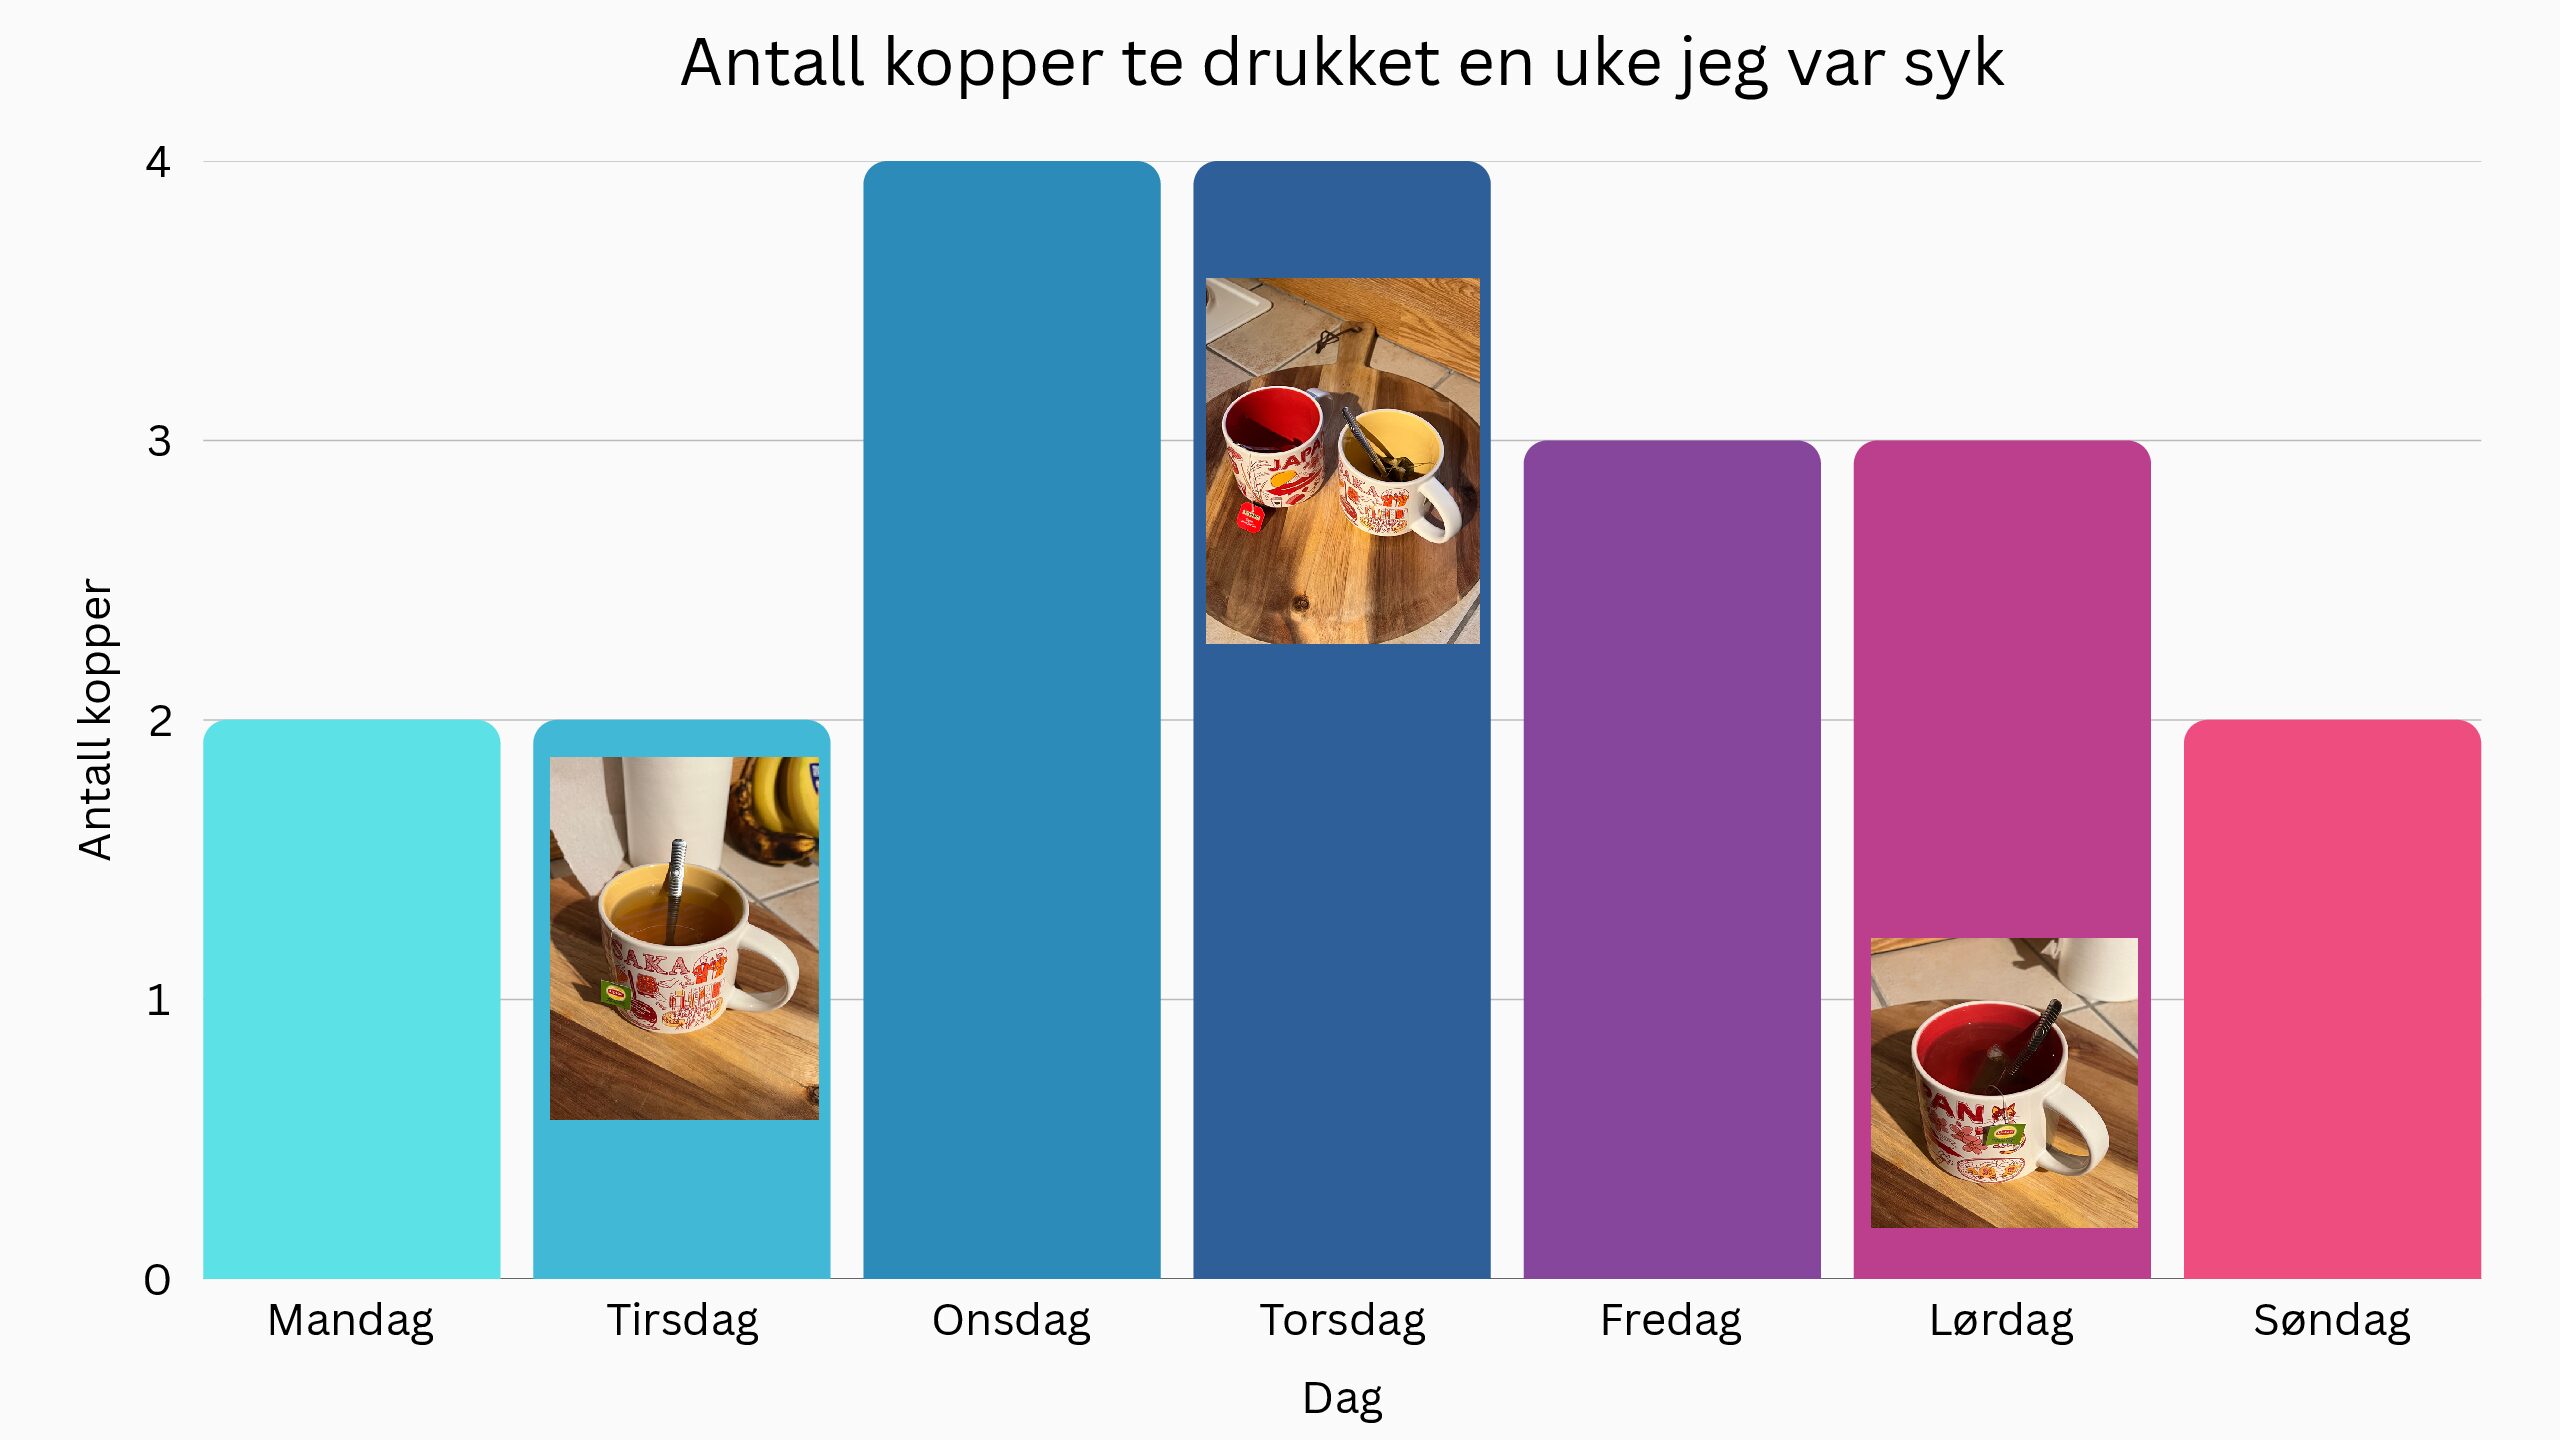
Dette er en graf som viser hvor mange kopper te jeg drakk hver dag en uke jeg var syk.
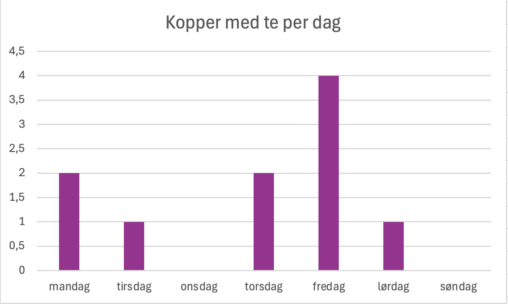
Dette diagrammet viser hvor mange kopper med te jeg har drukket per dag. Dataene er hentet fra en tilfeldig uke og er sortert fra mandag til og med…
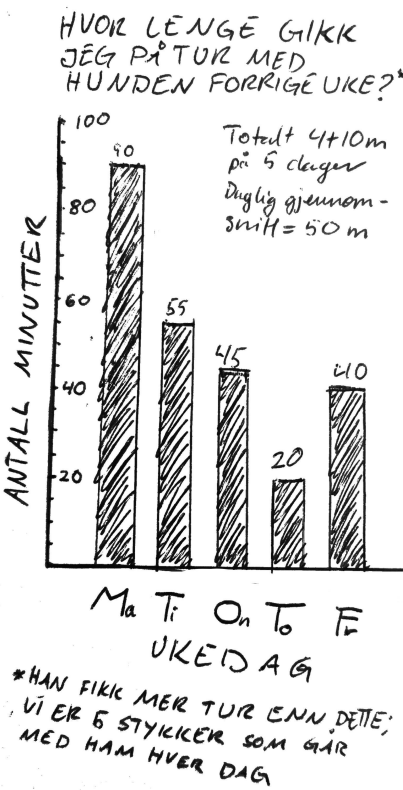
Antall minutter jeg gikk på tur med hunden hver ukedag forrige uke. Y-akse: tid i minutter, x-akse: ukedag.
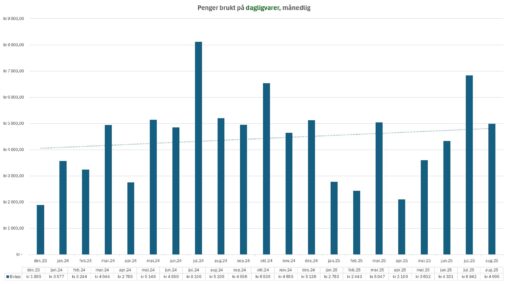
Dette diagrammet viser hvor mye penger jeg bruker i måneden på dagligvarer, i følge funksjonen “min økonomi” i Sparebanken1 sin mobilbank-app. Dette inkluderer bare penger som er brukt…
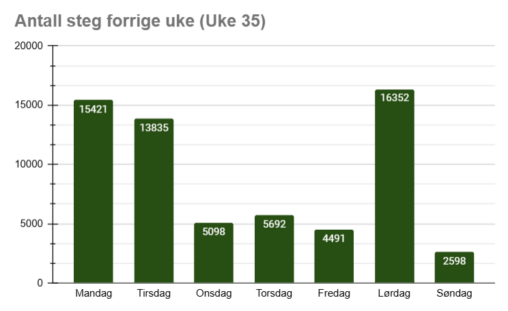
Bildet viser en bar chart over antall steg jeg tok hver dag forrige uke, fra den 25. august 2025 til den 31. august 2025. På mandagen jogget jeg…