
1154 Data visualizations Categorized "18-29" (page 1 of 58)
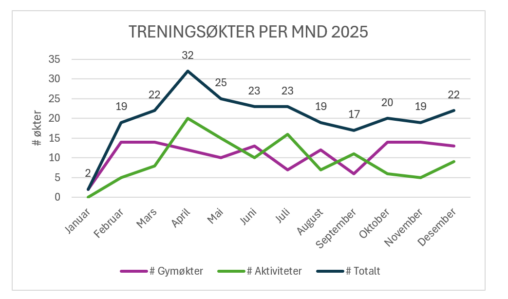
Antall treningsøkter per måned i 2025, fordelt i antall gymøkter og antall andre økter/aktiviteter (fotballtrening, fotballkamp, rulleski, ski, svømming, løping, fjelltur, osv)

Denne visualiseringen viser hvordan jeg brukte arbeidstimene mine i løpet av en uke som trainee i sjømatindustrien. Jeg loggførte tiden brukt på forskjellige oppgaver som sosiale medier, prosjektkoordinering,…
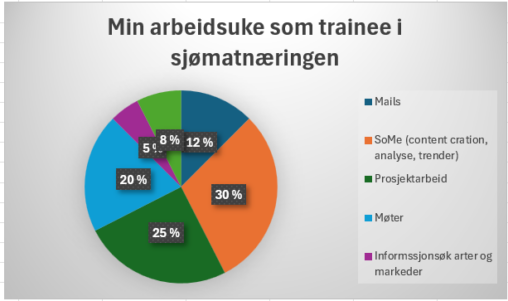
Antall timer jeg brukte på forskjellige oppgaver som Trainee i sjømatnæringen.
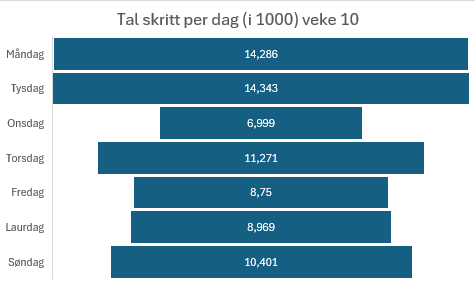
Tal på kor mange steg eg gjekk per dag forrige veke. Henta frå “helse”-appen på min Apple Watch. Eg har valt å presentere tala i 1000.

tid spilt på videospill siden 2026 per uke. datn kommer fra min steam bruker
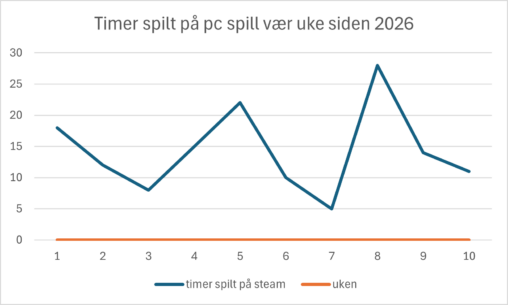
hours spent playing games per week since 2026 the date is for my steam aounct
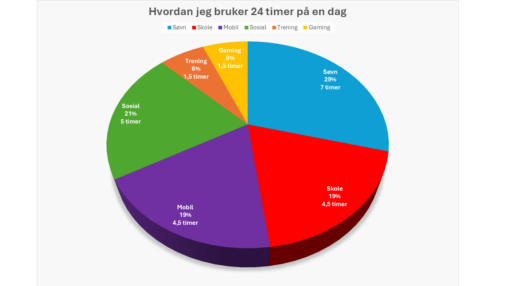
Visualiseringen viser at ila 24 timer, sover jeg mest (skulle gjerne vært 1 time lengre også, menmen), og er ganske sosial. Det verste jeg har på døgnet, er…
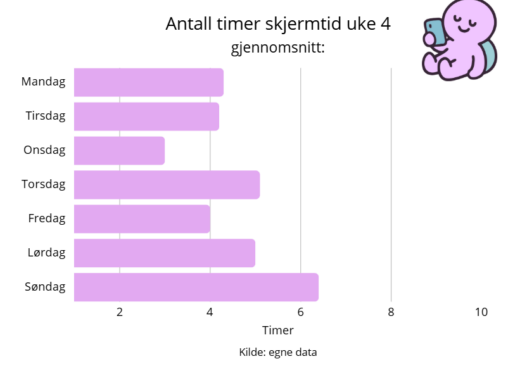
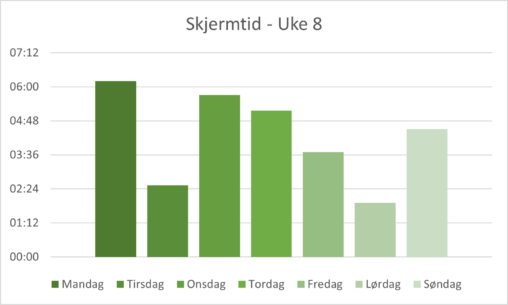
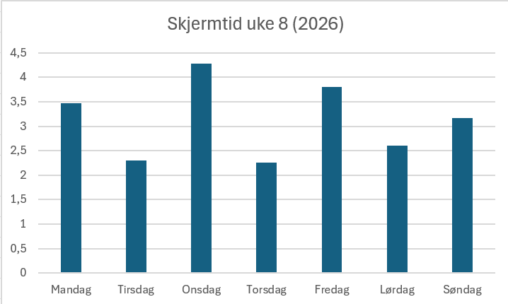
Oversikten viser alle dagene i uken og hvor mye skjermtid jeg hadde de gitte dagene. X-aksen representerer antall timer per dag og y-aksen representerer hvilken dag i uken…
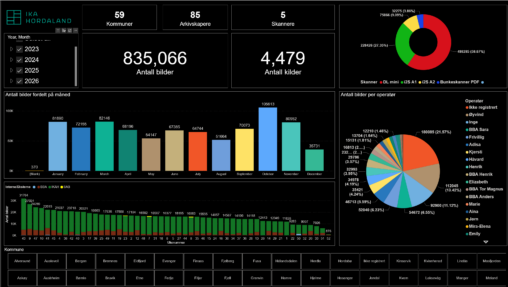
Dette er en visualisering av data over produksjon i kulturarv digitisering gjennom tid. Den gir en oversikt over antall bilder, kilder som er skannet, hvem som er operatør…
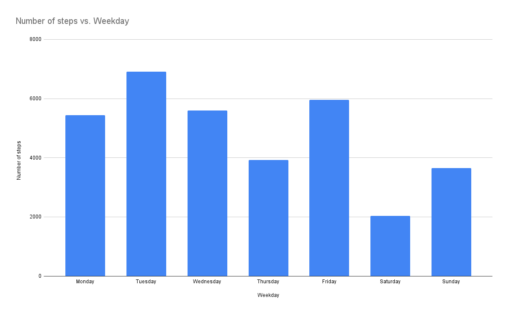
The bar chart visualises the number of steps I took that my digital watch recorded in week 8. The number of steps have been divided into weekdays to…
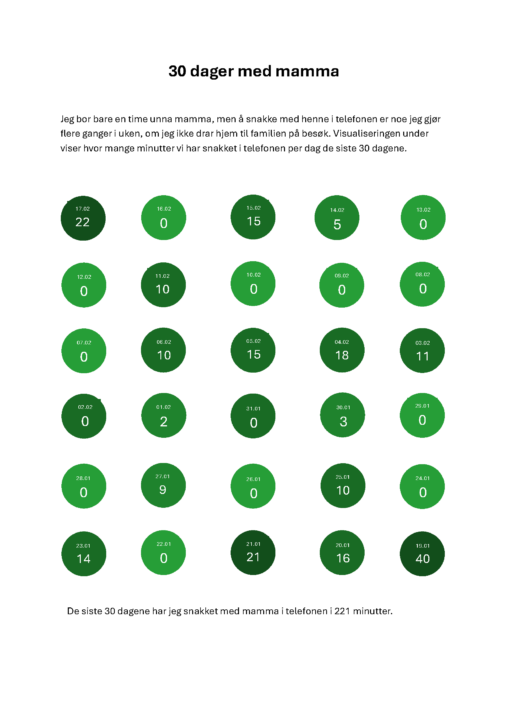
Jeg har brukt telefonloggen for å se hvor mange minutter jeg har snakket i telefon med mamma over en 30 dagers periode. Perioden er fra 19.01 til 17.02…
Eg hadde eit mål om å selje 100 ting i 2024. For å gjere det meir motiverande laga eg eit illustrativt skjema som eg hang på veggen, der…
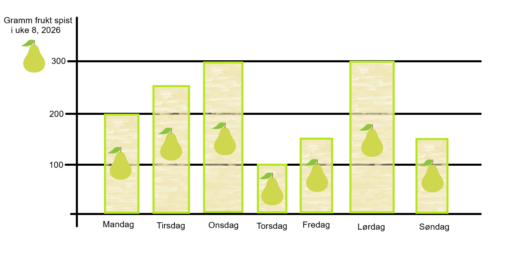
Dette er en visualisering av hvor mange gram frukt jeg har spist i uke 08 i 2026.

Menstruation cycle of a woman (born year 1998) from March 2024-February 2026. The data represents how many days spent menstruating each day of a given month. The data…
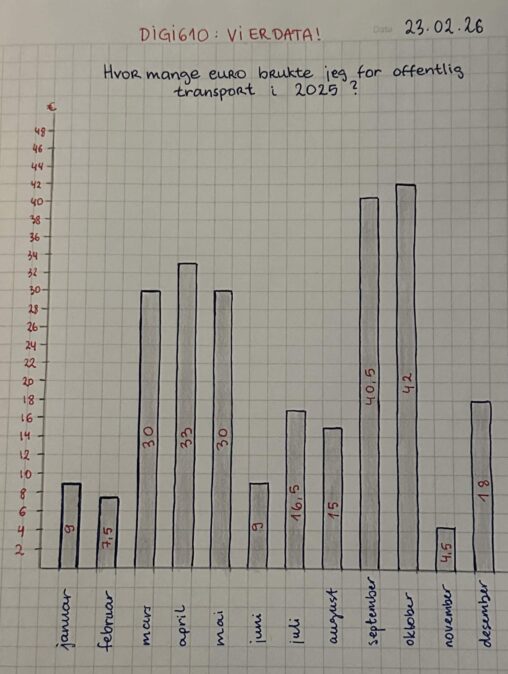
Y axis being euros, X axis being months of the year, I present how much money I have spent on public transport in year 2025. Data is all…
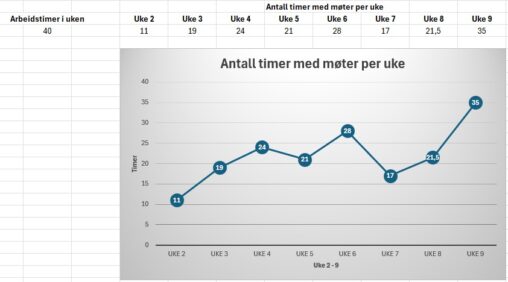
I’ve made this visualization based on how many hour’s I’ve spendt in a meeting each work week since the new year. The units are in hour’s and weeks….

Skjermtid på PC angitt i timer per dag mandag til søndag en vanlig uke. Visualiseringen er gjort i Excel.