
84 Data visualizations Categorized "0-18" (page 5 of 5)
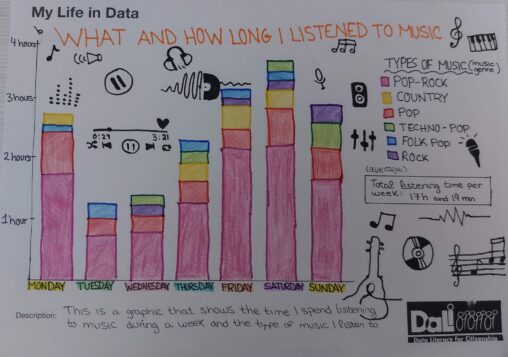
This is a graphic that shows the time I spend listening to music during a week and the type of music I listen to. The genres of music…

In this data visualization I am representing the days I work during the week, the time I use my mobile phone and the steps I walk.

Here you can see a timetable that represents the time that I spend each day of the week in the university, with my friends, doing other activities and…

Here you can see a timetable that represents the time that I spend each day of the week in the university, with my friends, doing other activities and…