
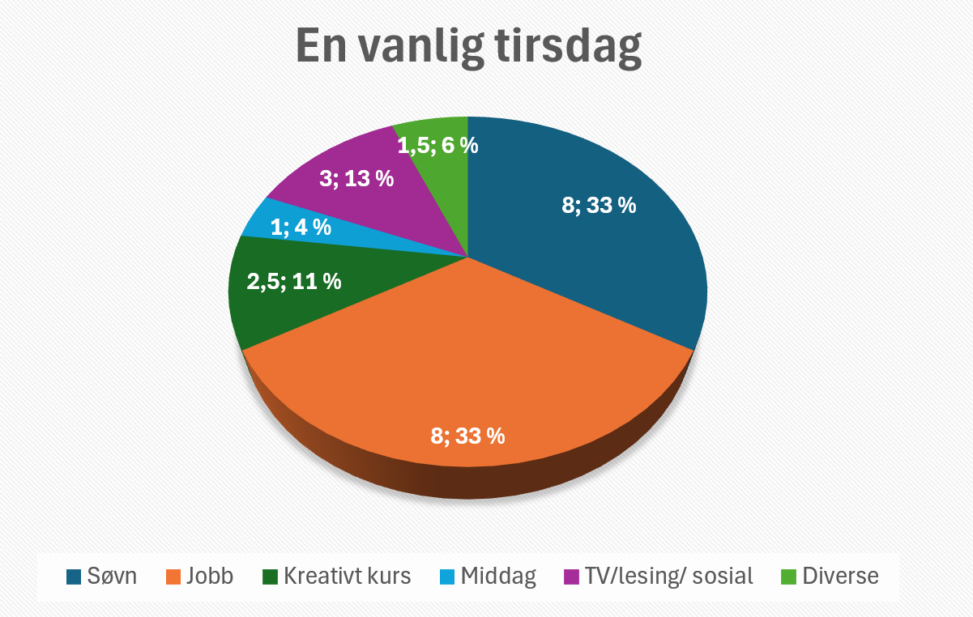
This data visualization represents how I spend my time during a typical Tuesday. The chart shows the distribution of 24 hours across daily activities. Sleep and work each account for 8 hours (33% each). Creative course activities take 2.5 hours (11%), TV/reading/social time takes 3 hours (13%), dinner takes 1 hour (4%), and other activities account for 1.5 hours (6%).
The data are measured in hours and reflect a typical weekday routine rather than a specific calendar date.
The data were collected and produced by the author based on personal daily activities. The visualization and data are original and shared under a Creative Commons Attribution (CC BY) licence.