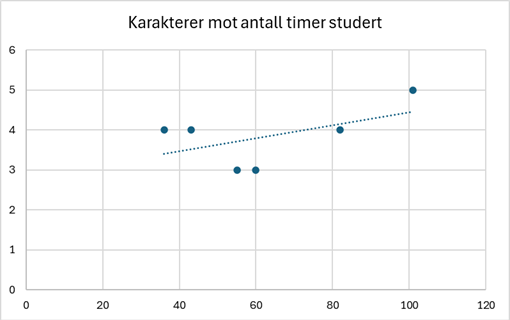
The visualization shows a scatter plot that plots the hours spent studying for six separate 10 ECTS university level courses of varying difficulty and the grade of the respective courses.

A SPLOT on the Web: DALI worlds.
Blame @cogdog for the TRU Collector Theme, based on Fukasawa by Anders Norén.
The visualization shows a scatter plot that plots the hours spent studying for six separate 10 ECTS university level courses of varying difficulty and the grade of the respective courses.