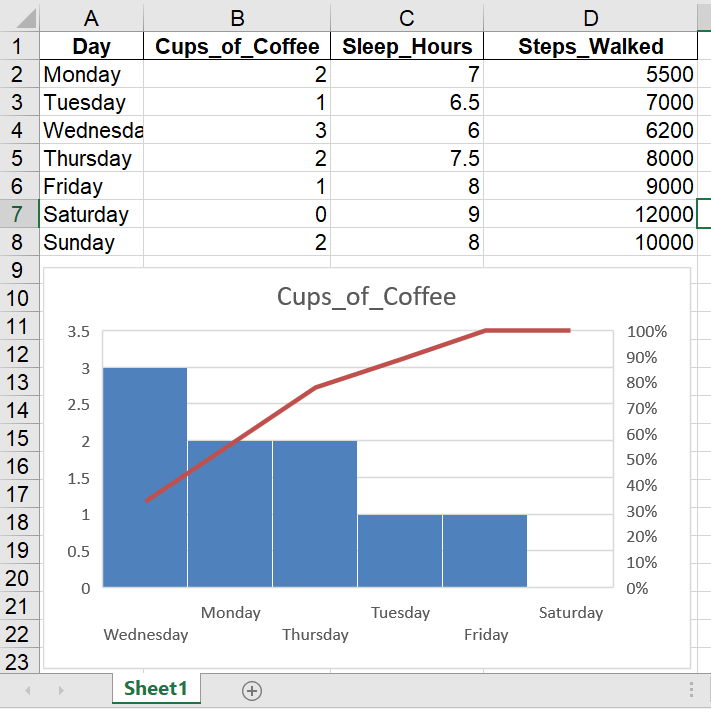
This visualization shows how many cups of coffee I drank each day during one week. The data was self-recorded as part of a personal daily routine tracking exercise. The chart is created in Excel using self-collected data. License: CC BY-SA

A SPLOT on the Web: DALI worlds.
Blame @cogdog for the TRU Collector Theme, based on Fukasawa by Anders Norén.
This visualization shows how many cups of coffee I drank each day during one week. The data was self-recorded as part of a personal daily routine tracking exercise. The chart is created in Excel using self-collected data. License: CC BY-SA