
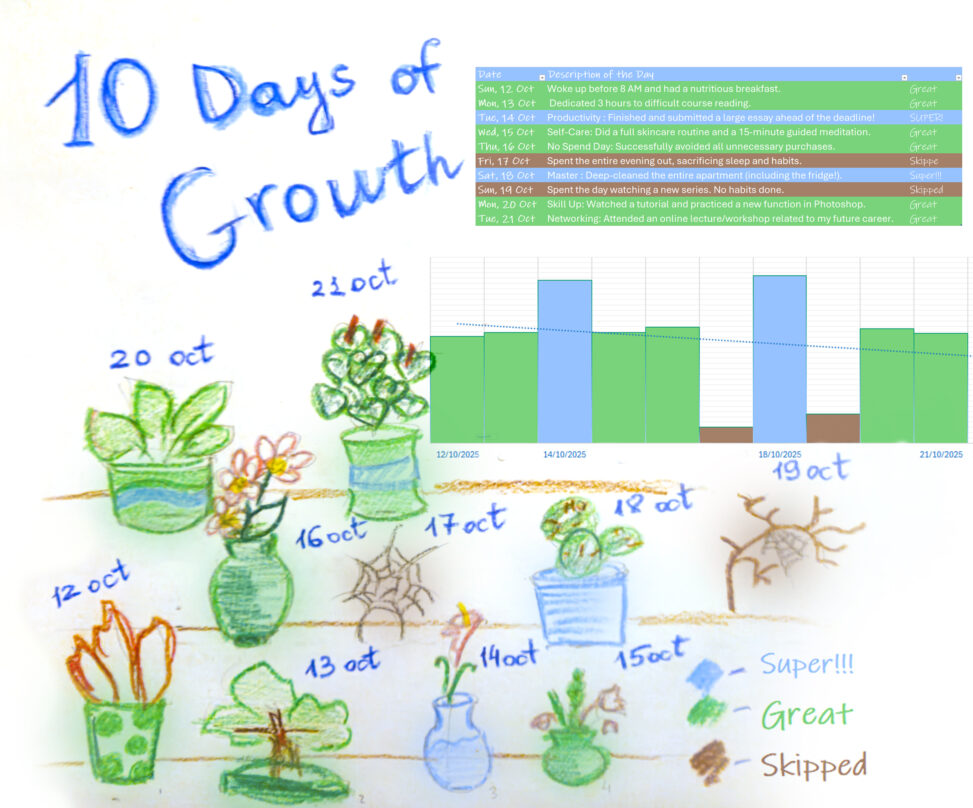
This is my personal habit tracker for 10 days – from October 12 to October 21, 2025. I visualized my progress through the metaphor of growing plants because I wanted to see how my small daily efforts turn into something alive and beautiful.
How it works:
Every day I rated myself on three levels:
– “Super!!!” (blue bars) – when I really gave it my all 100% (like October 14 when I finished a big essay before the deadline, or October 18 when I deep-cleaned my entire apartment)
– “Great” (green bars) – good productive days with healthy habits
– “Skipped” (brown bars) – days when I messed up (on the 17th I stayed out all night partying, and on the 19th I just binge-watched series all day)
In the table on the right, I wrote down specific actions: waking up early and eating breakfast, learning Photoshop, networking, meditation or just procrastinated.
The chart shows clearly that out of 10 days, I had 2 super-productive days, 6 good ones, and 2 fails. Mathematically that’s 80% success rate, which for a student, honestly, isn’t bad!