
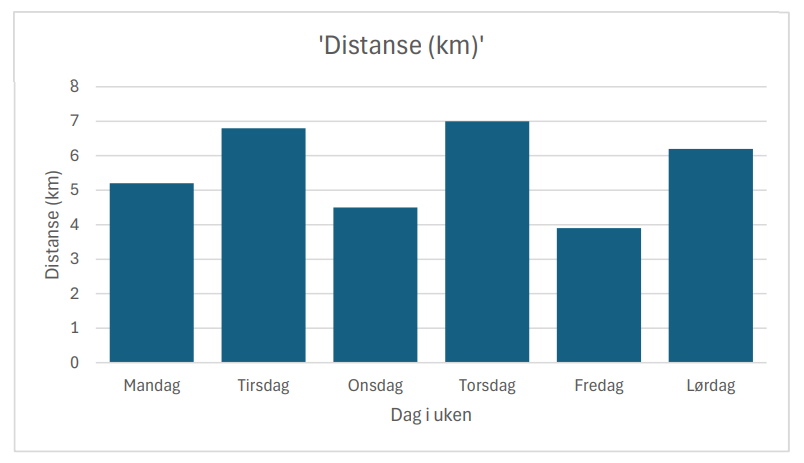
This bar chart shows my running distance per day, from Mandag (Monday) to Lørdag (Saturday). The vertical axis shows distance in kilometers, while the horizontal axis lists each day of the week.
The data reflects daily training volumes, with Tirsdag (Tuesday) and Torsdag (Thursday) being the longest runs. This visualization helps me monitor my weekly running habits and adjust training load based on volume.
The chart is built using Microsoft Excel with Norwegian labels and formatting.
Data is based on self-tracked running sessions.